

Century 21 People’s Choice Realty Inc., Brokerage
120 MATHESON BLVD E #103
MISSISSAUGA, Ontario
L4Z 1X1


Toronto, Black Creek, M3N 1N8
$929,000
Listed by RE/MAX PREMIER INC..
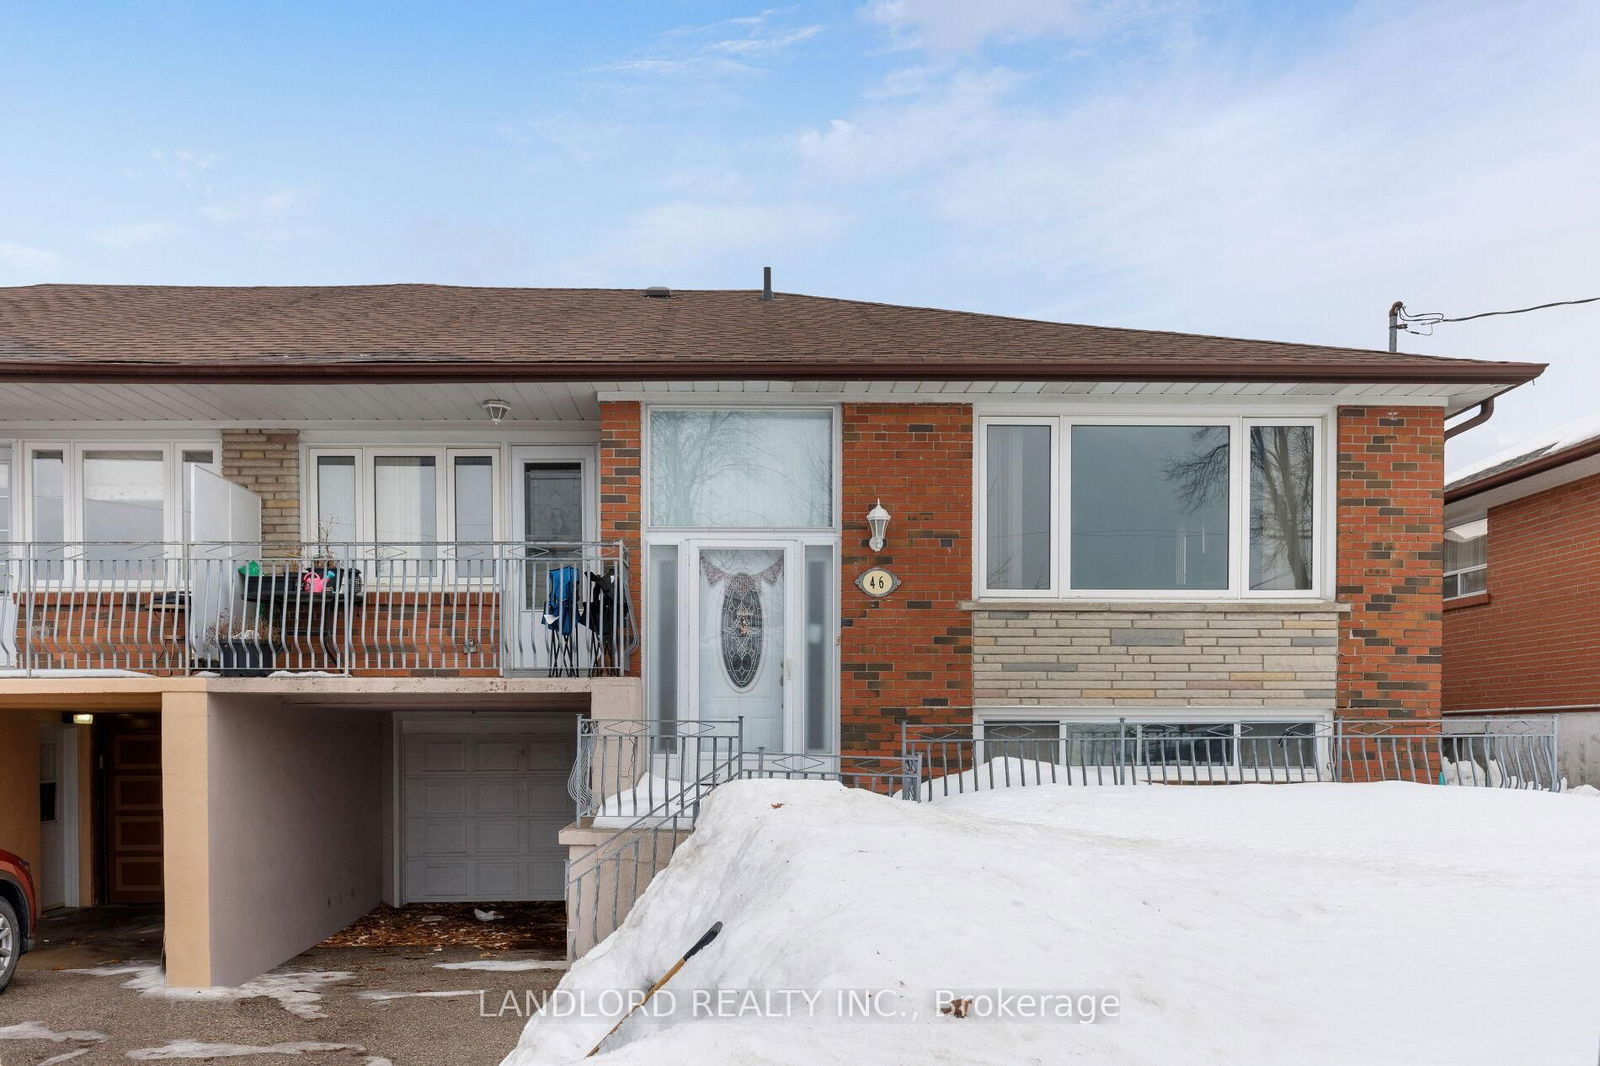
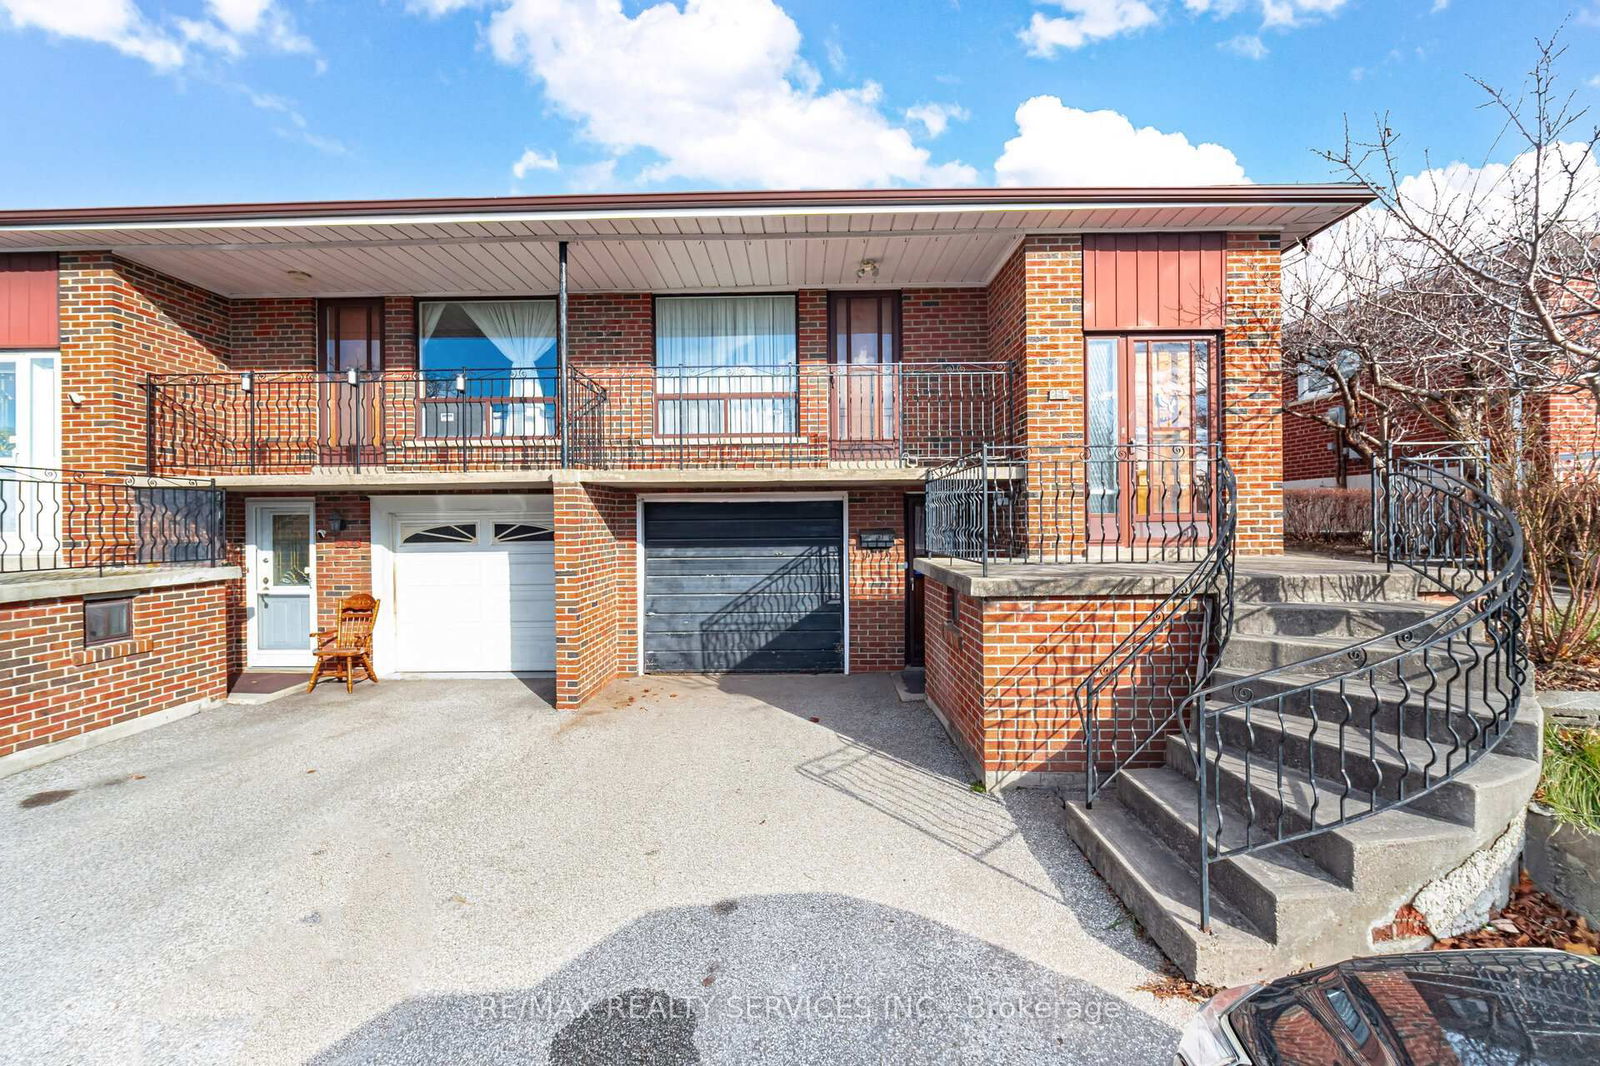
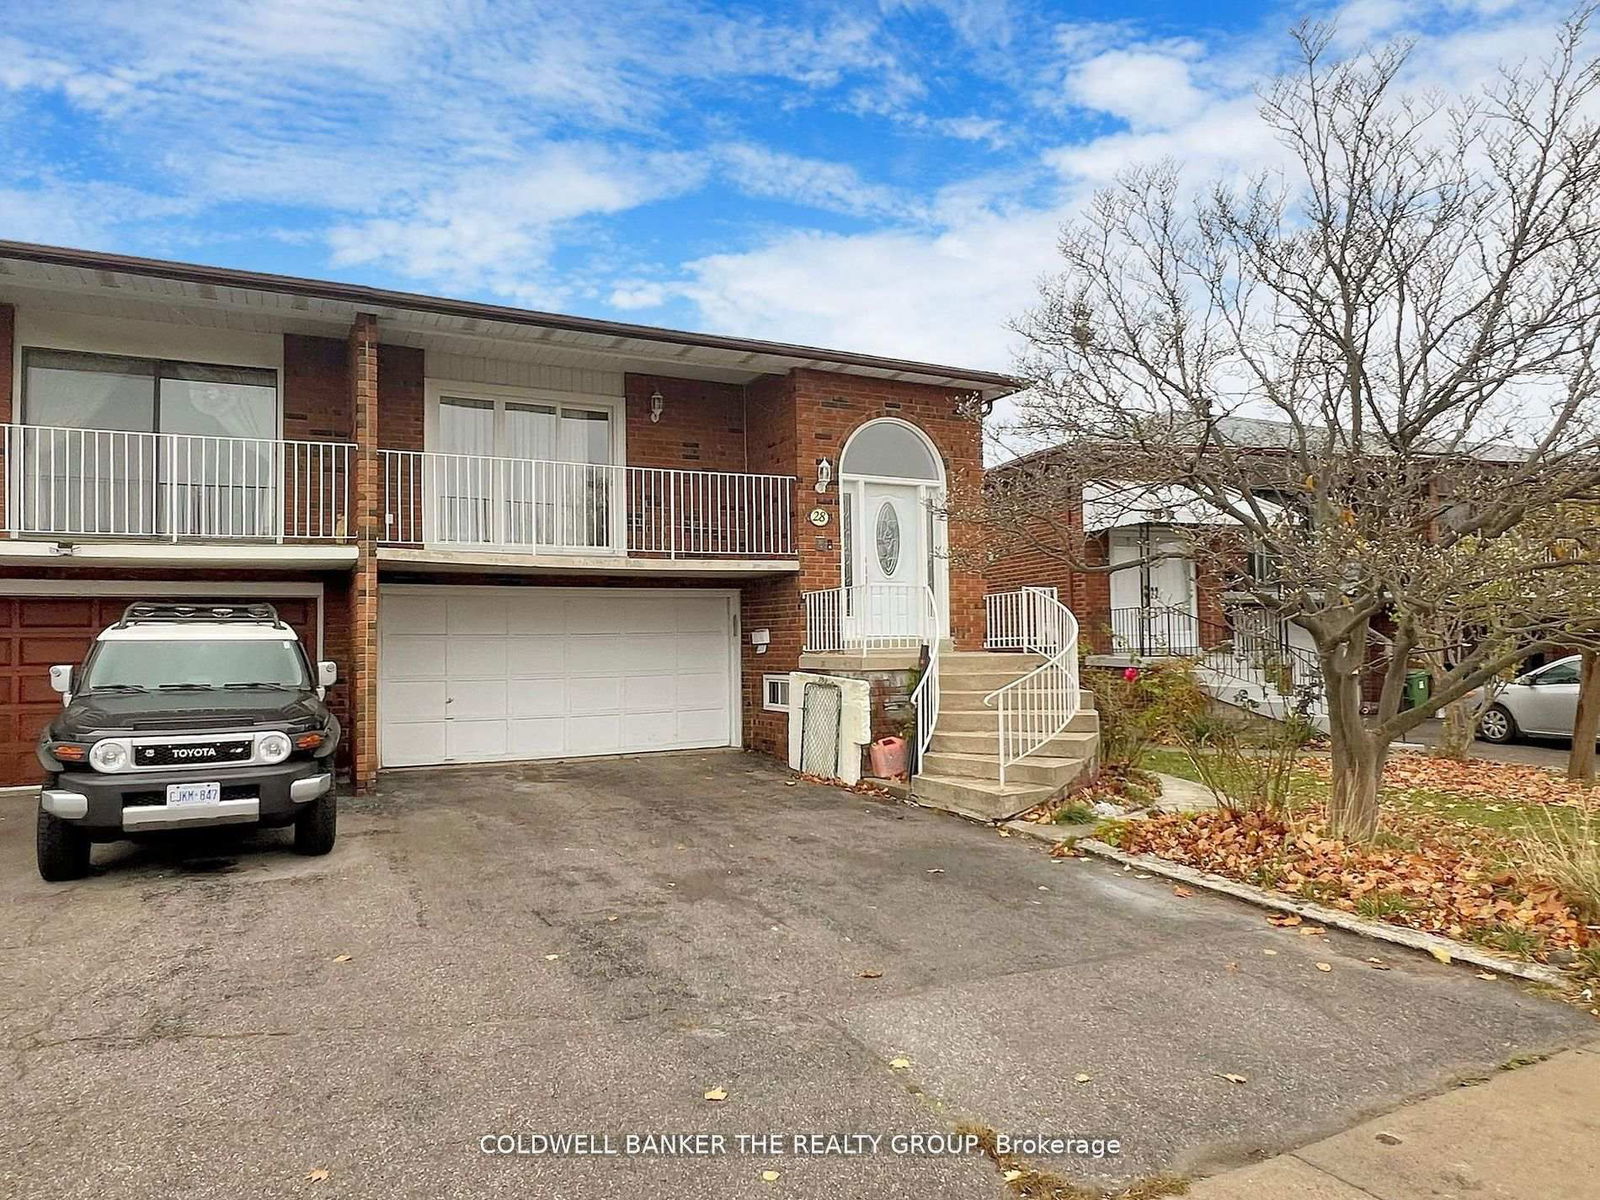
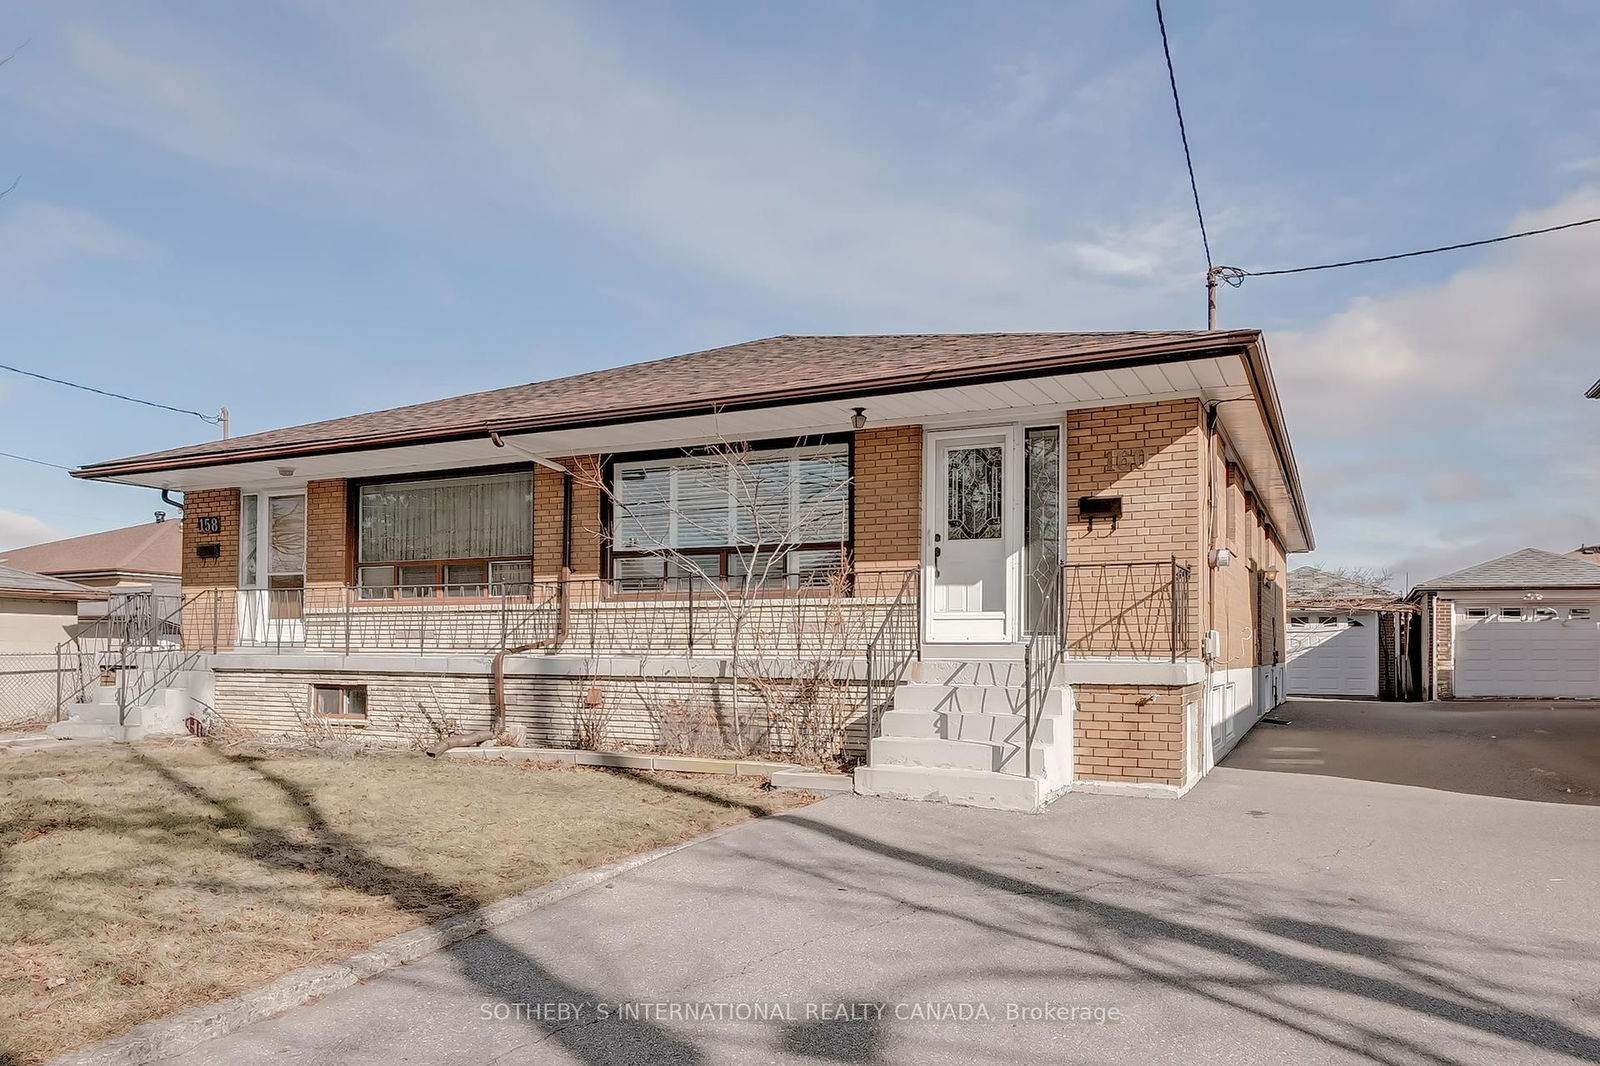
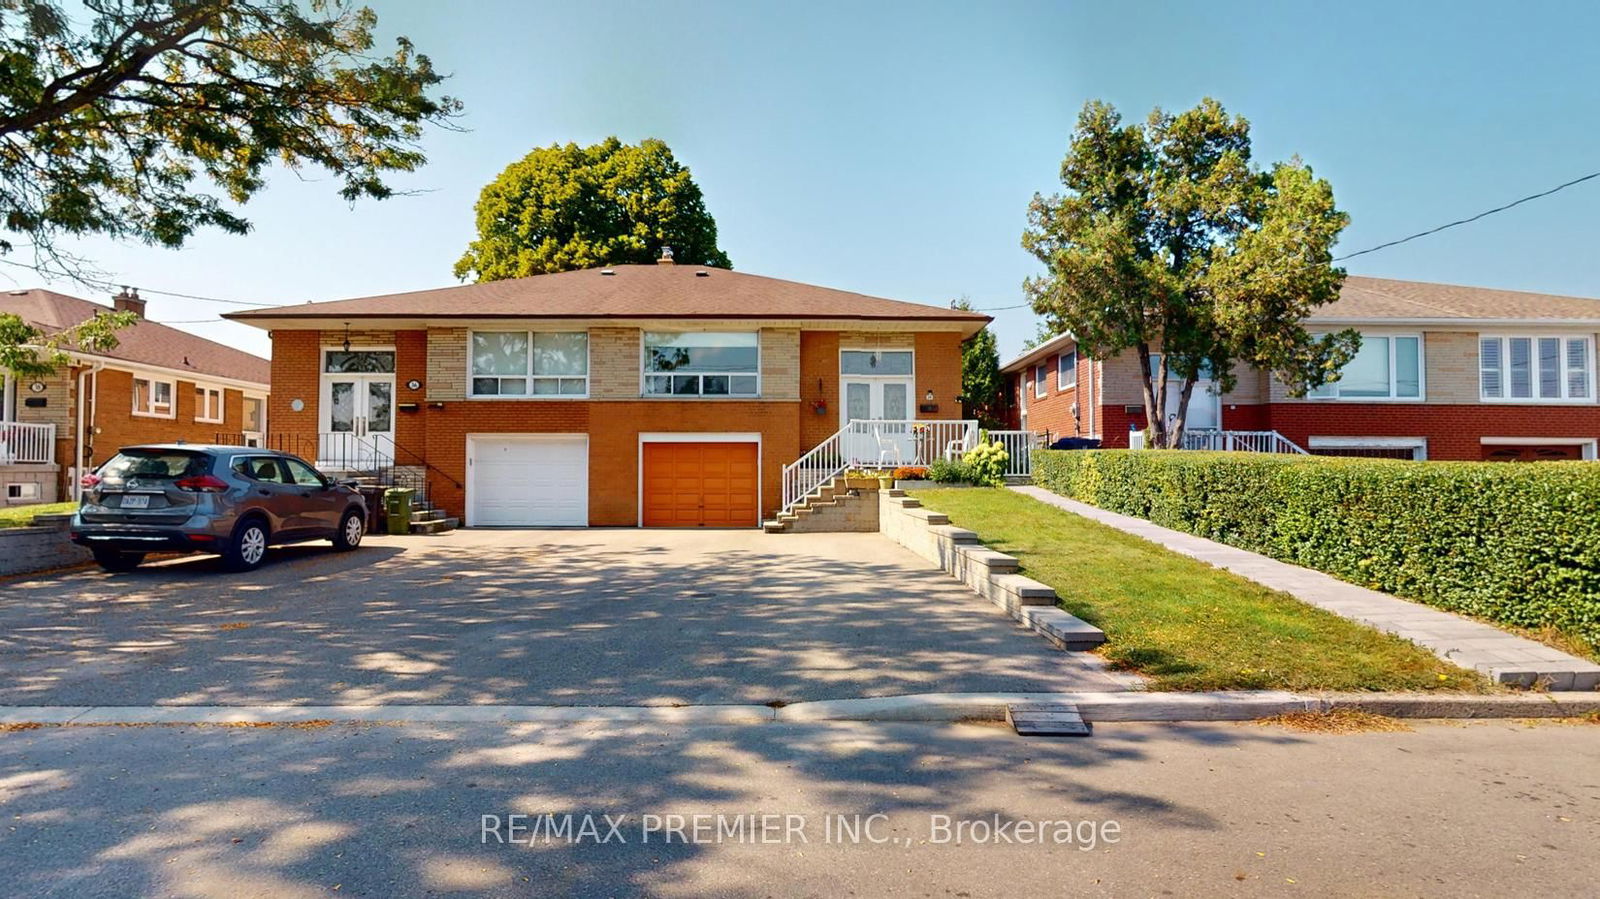
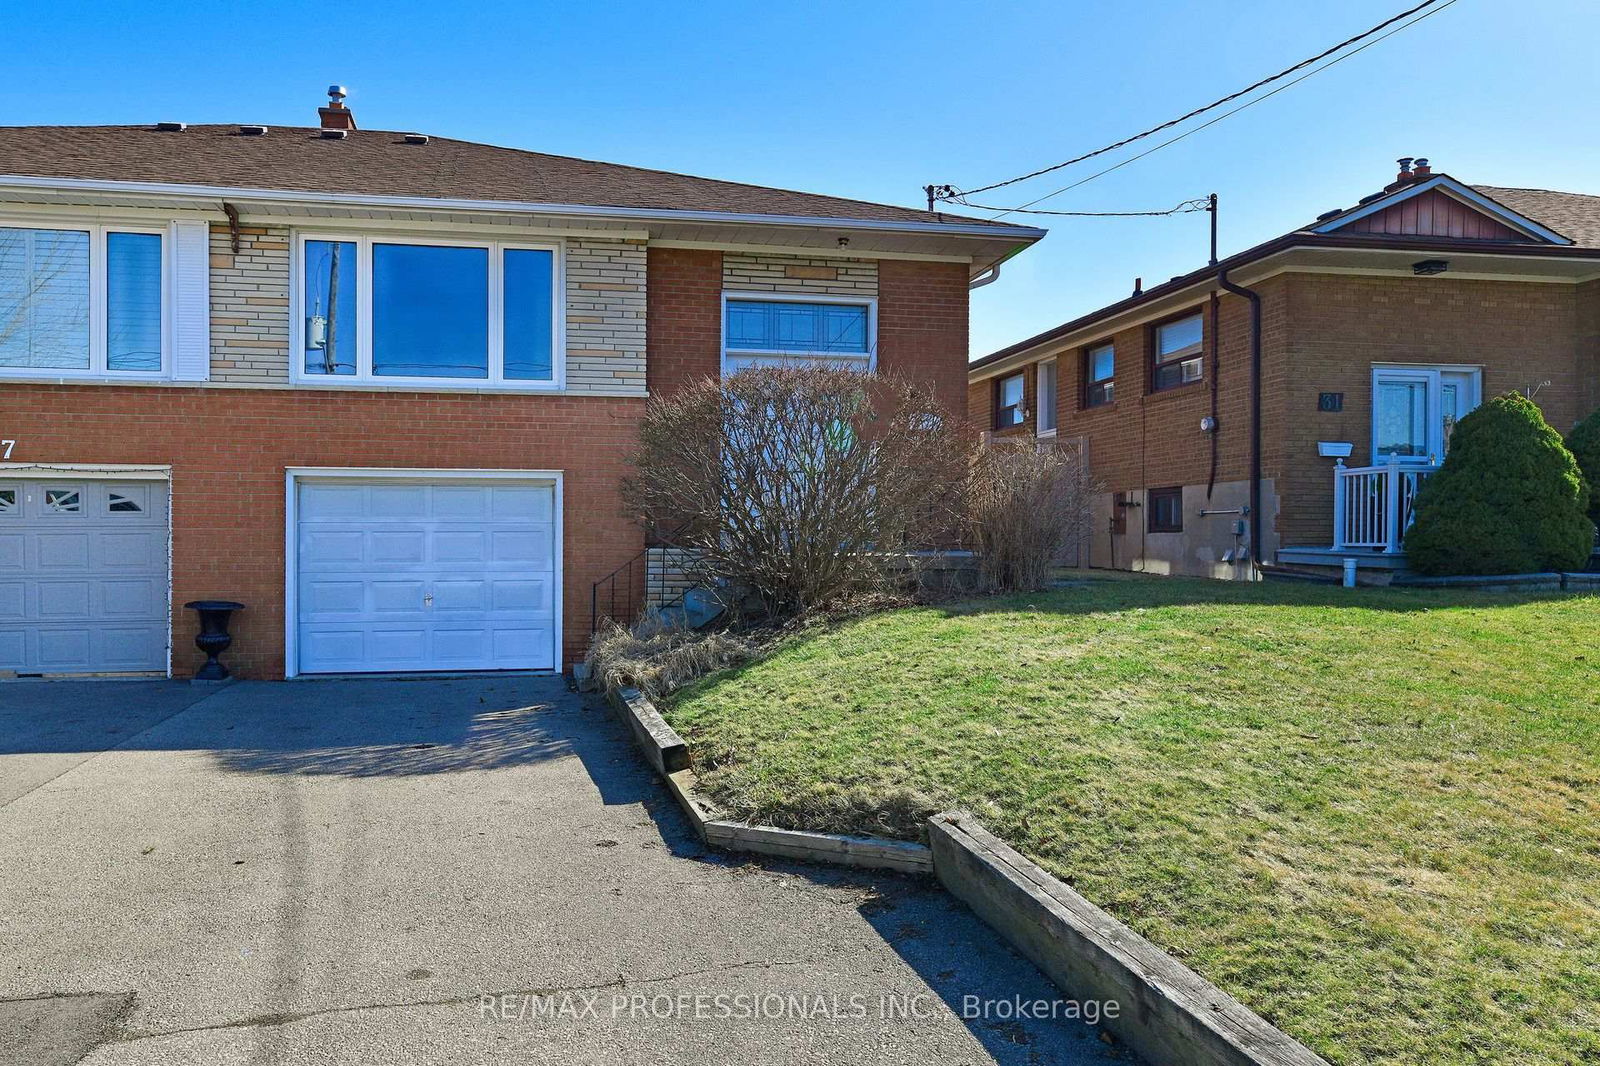
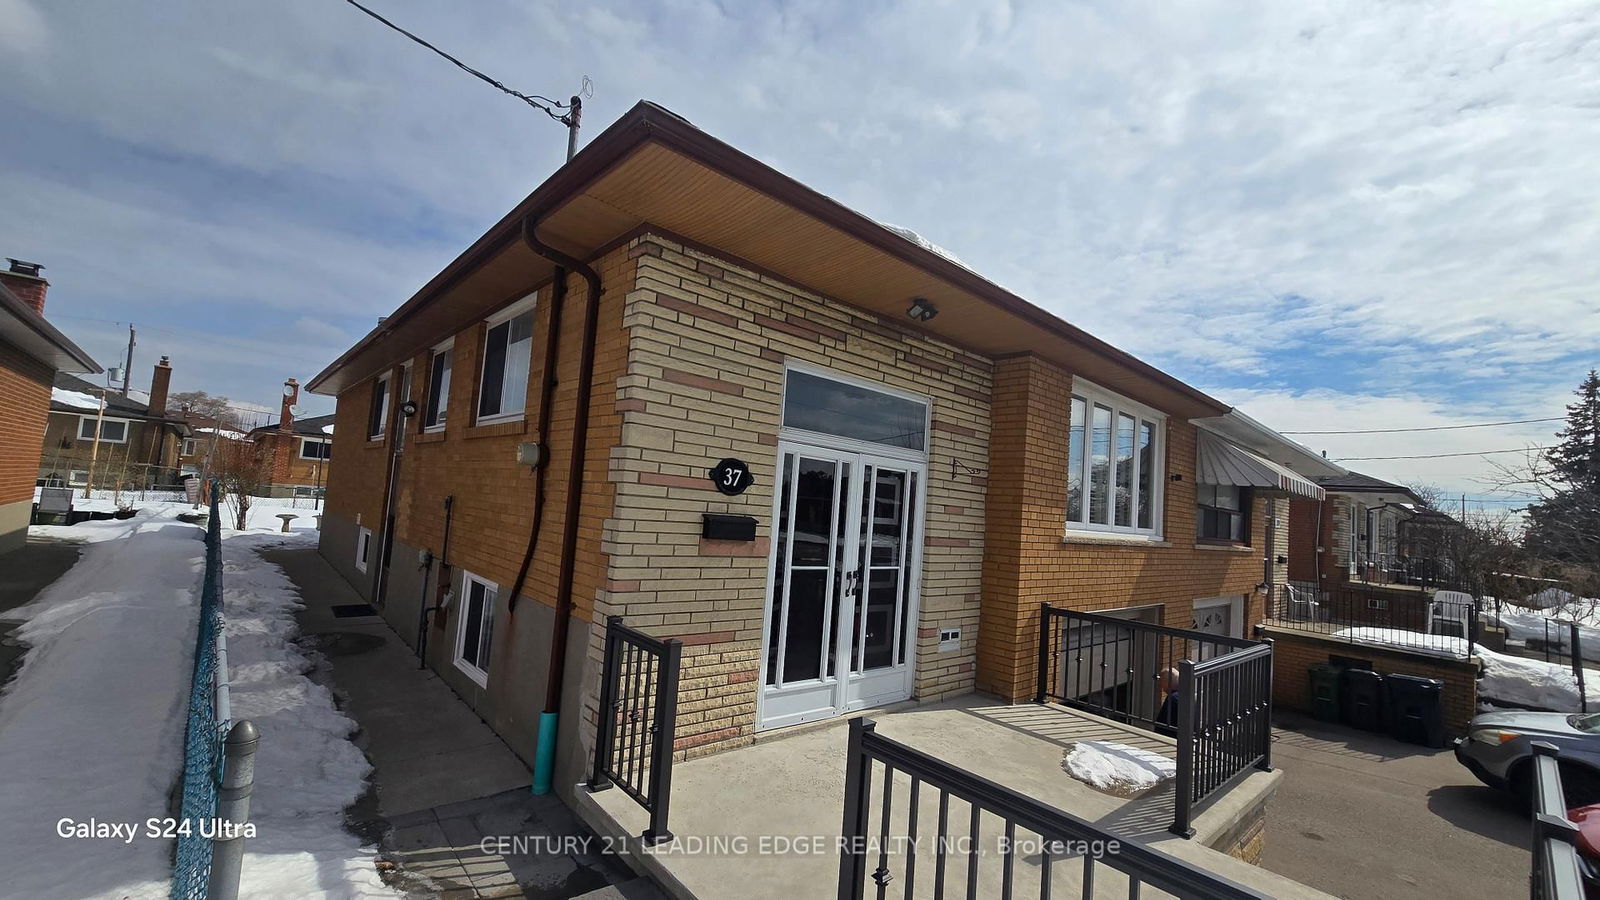
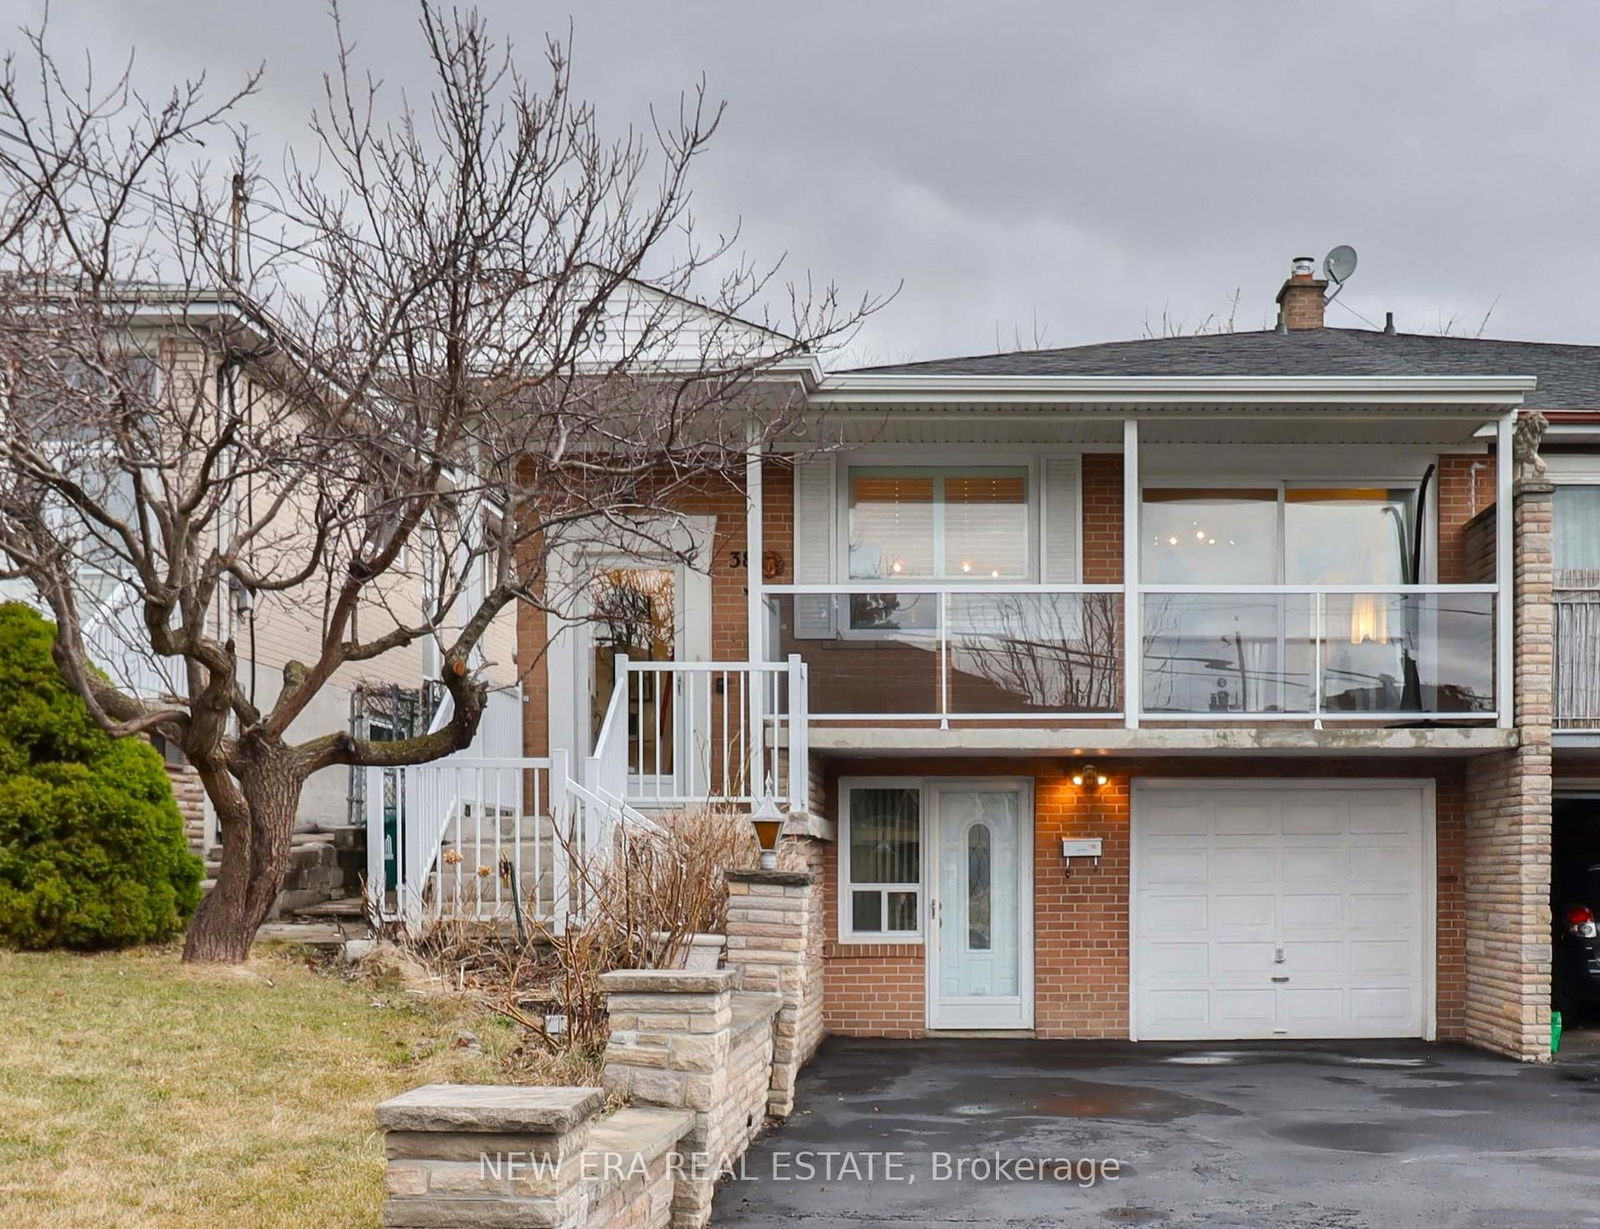
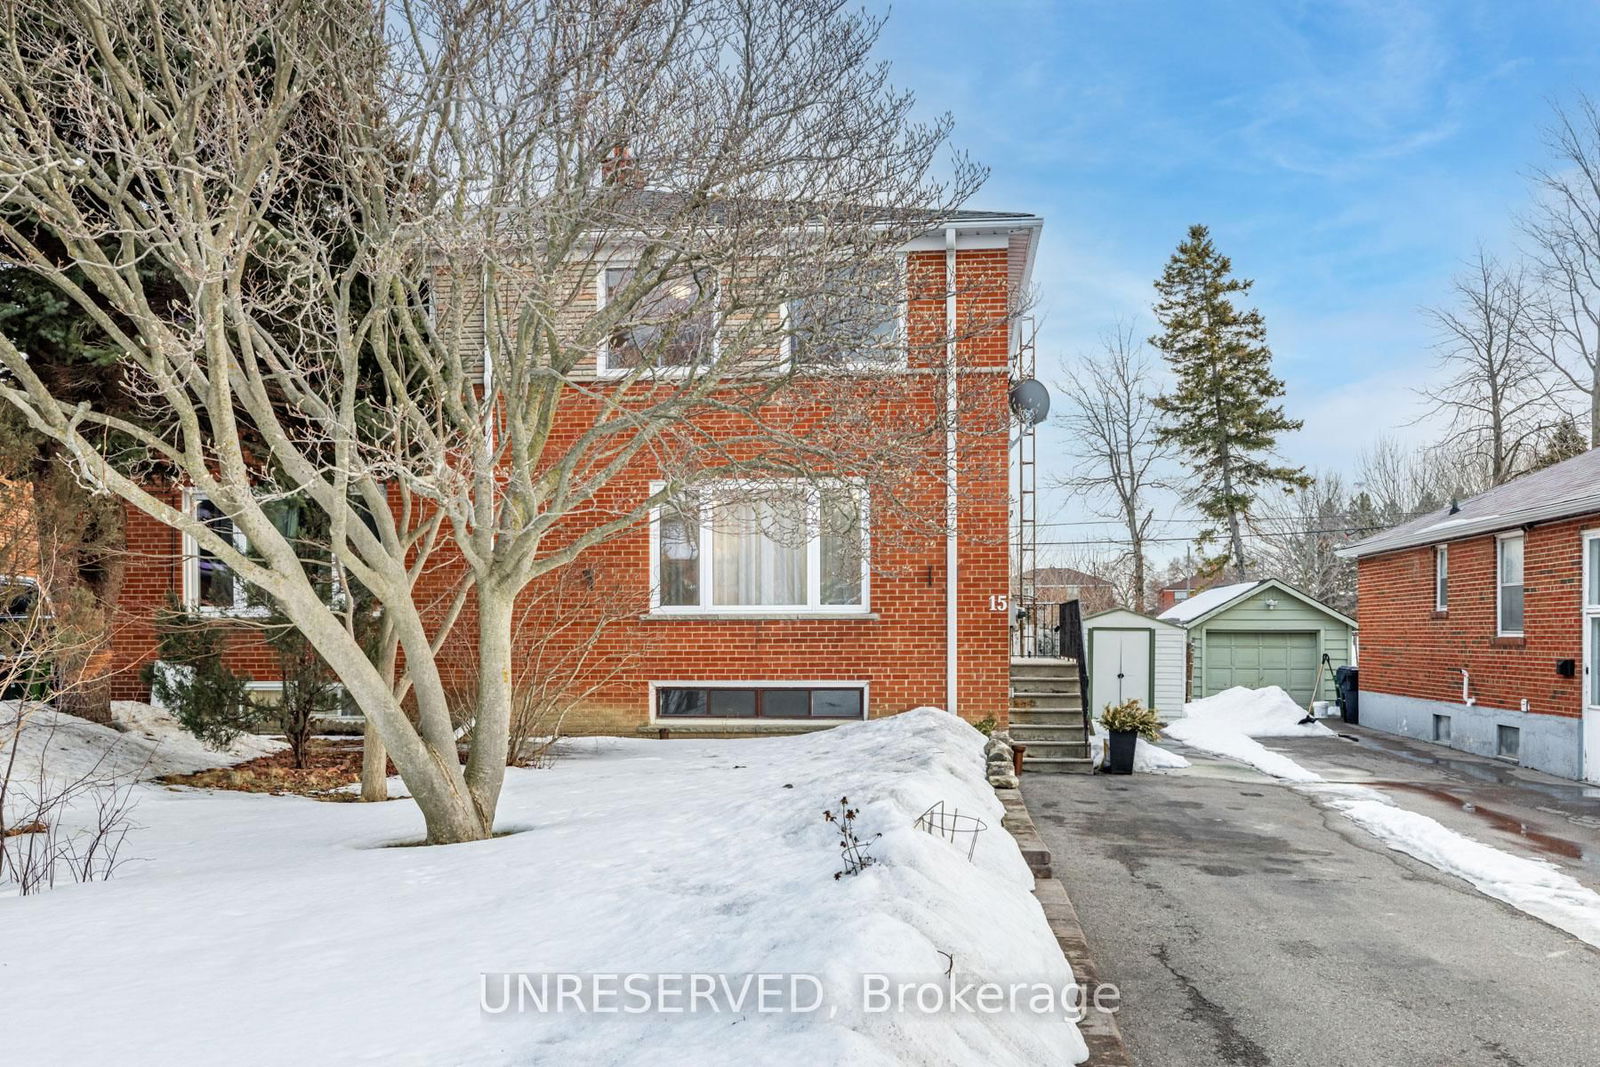
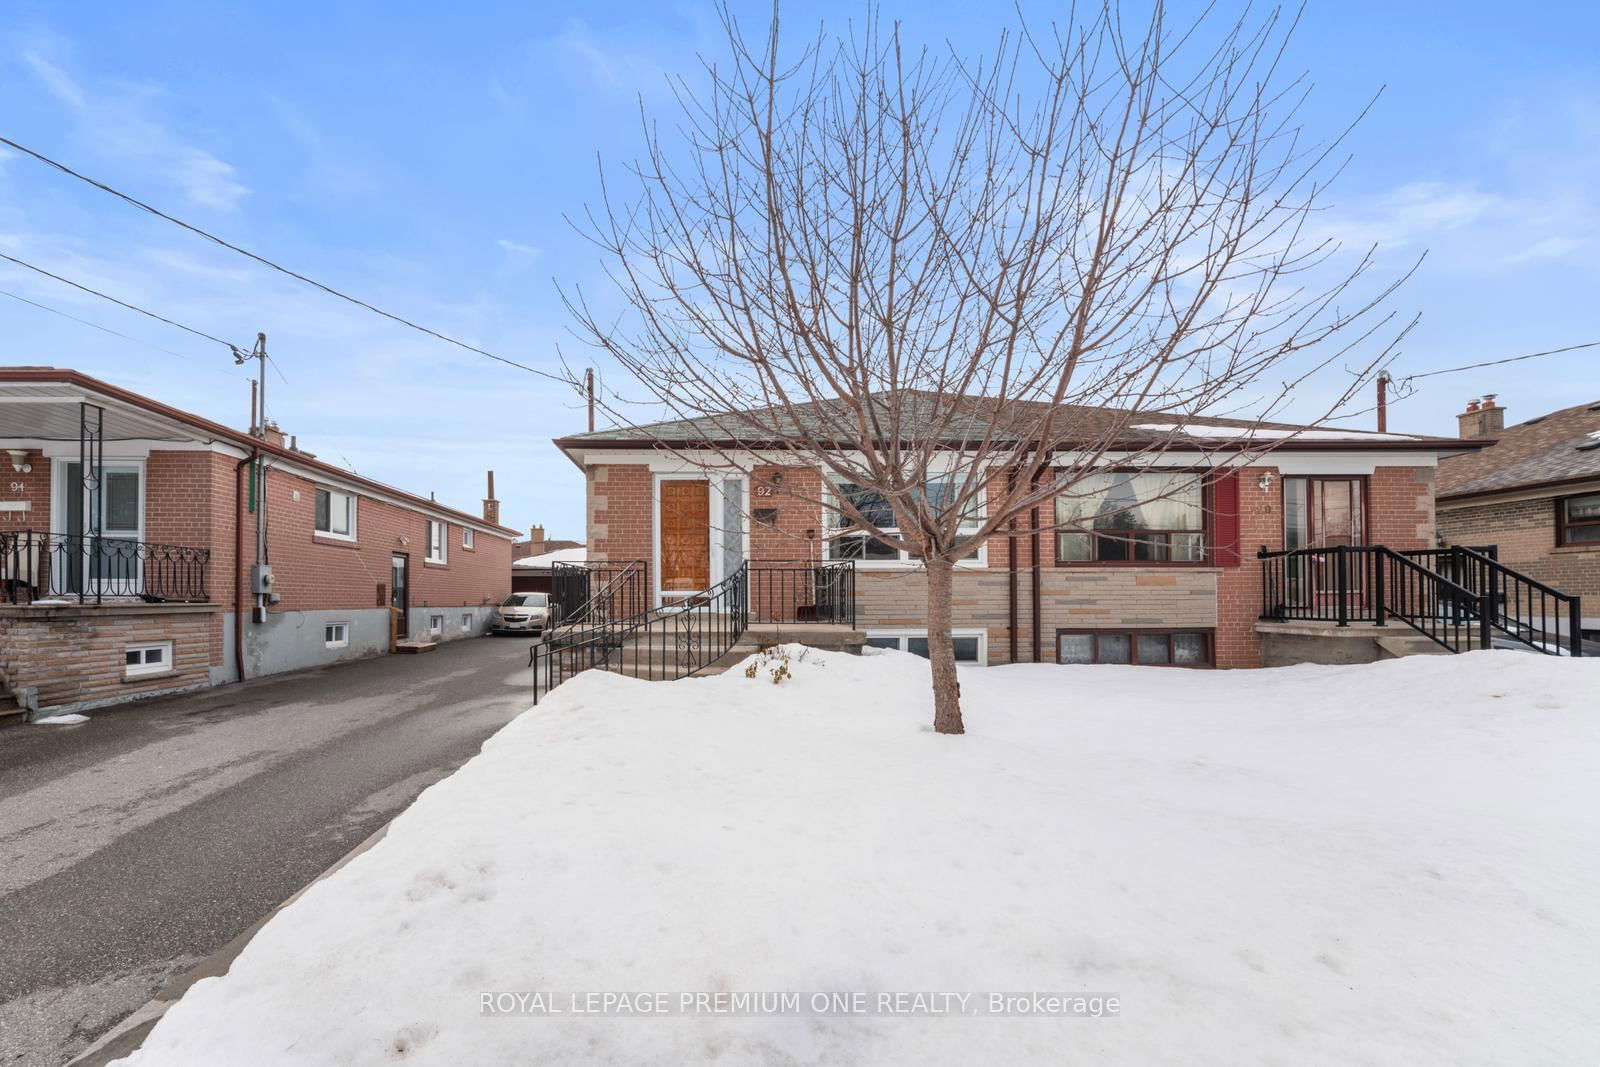
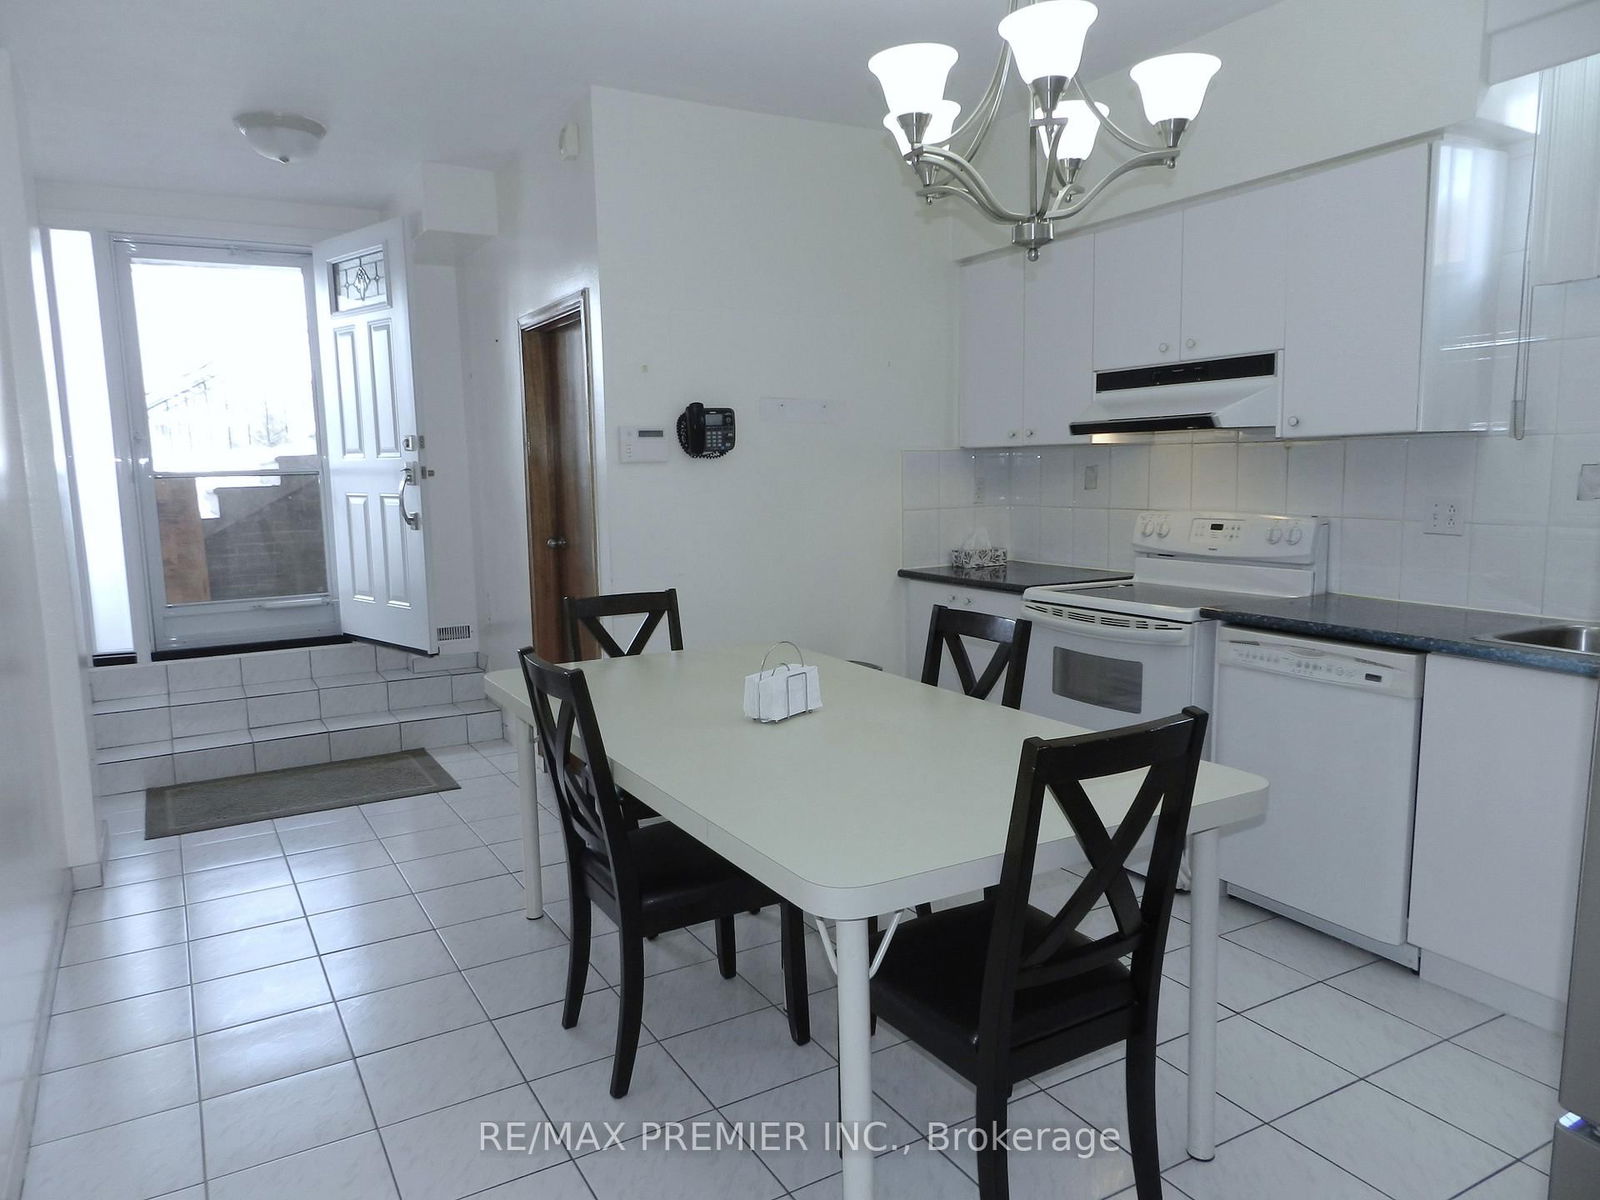
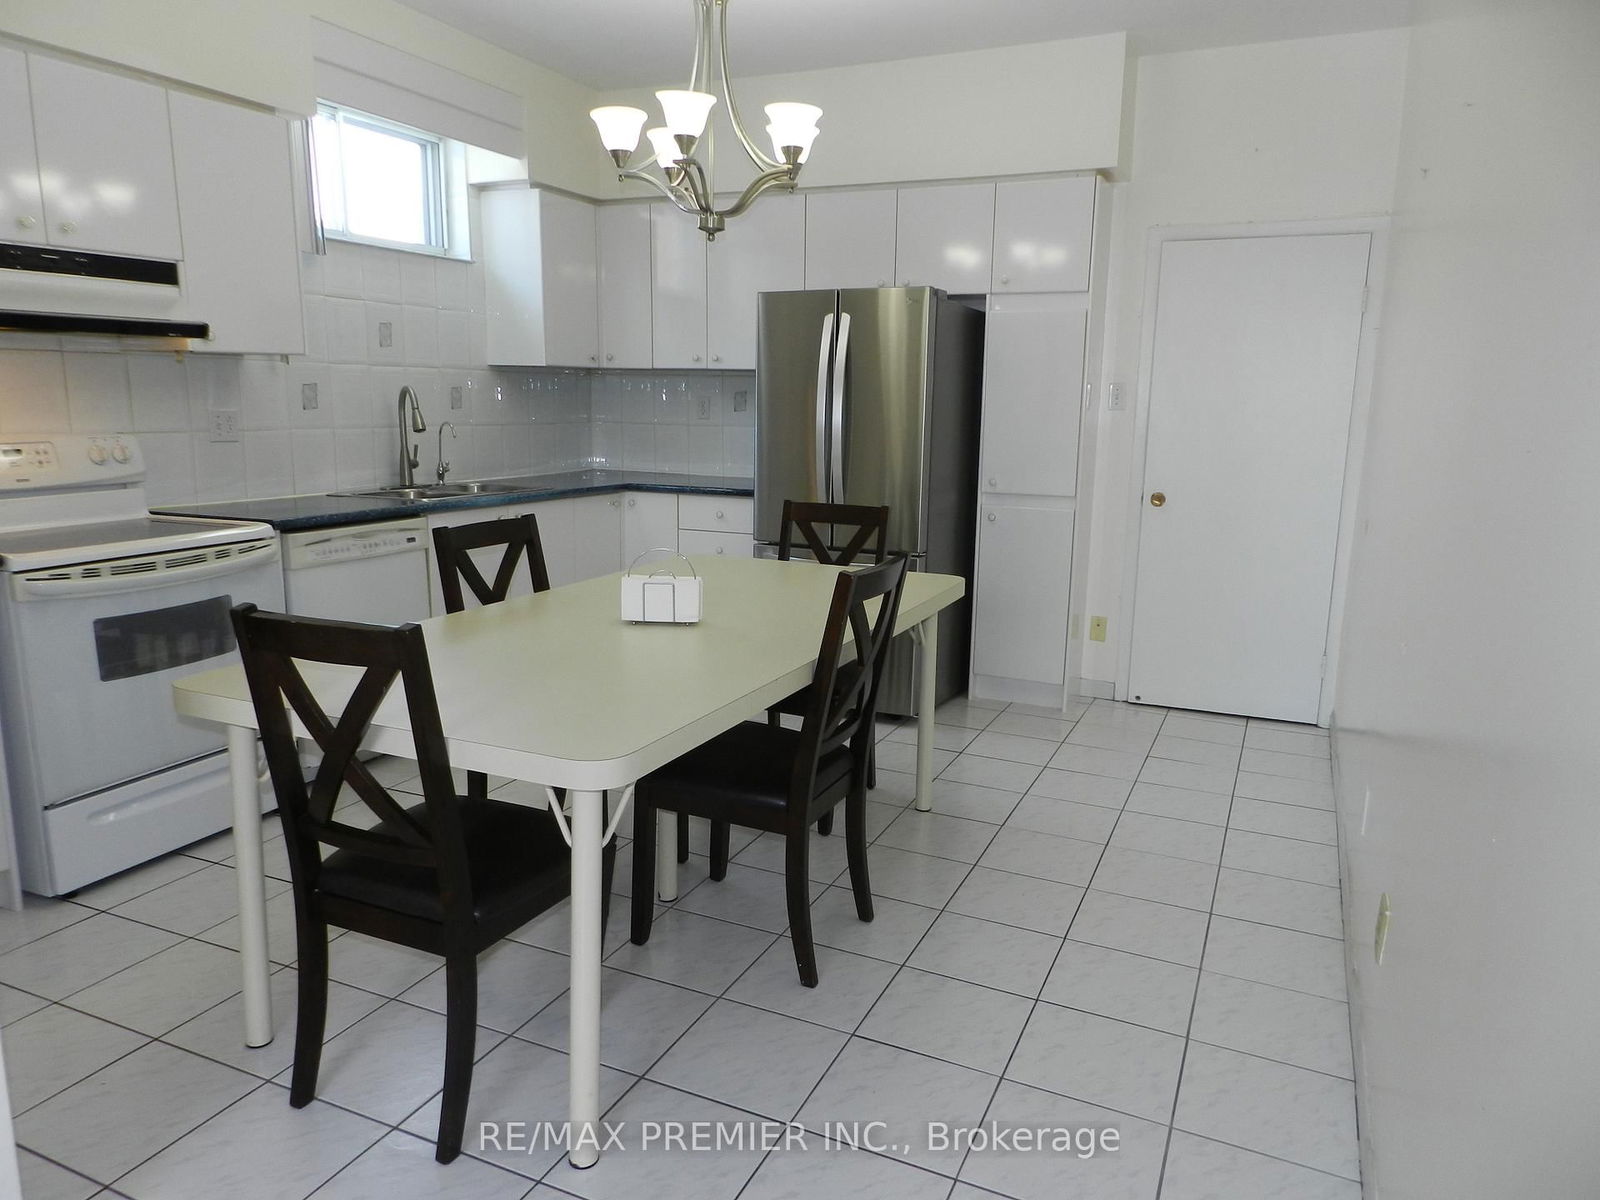
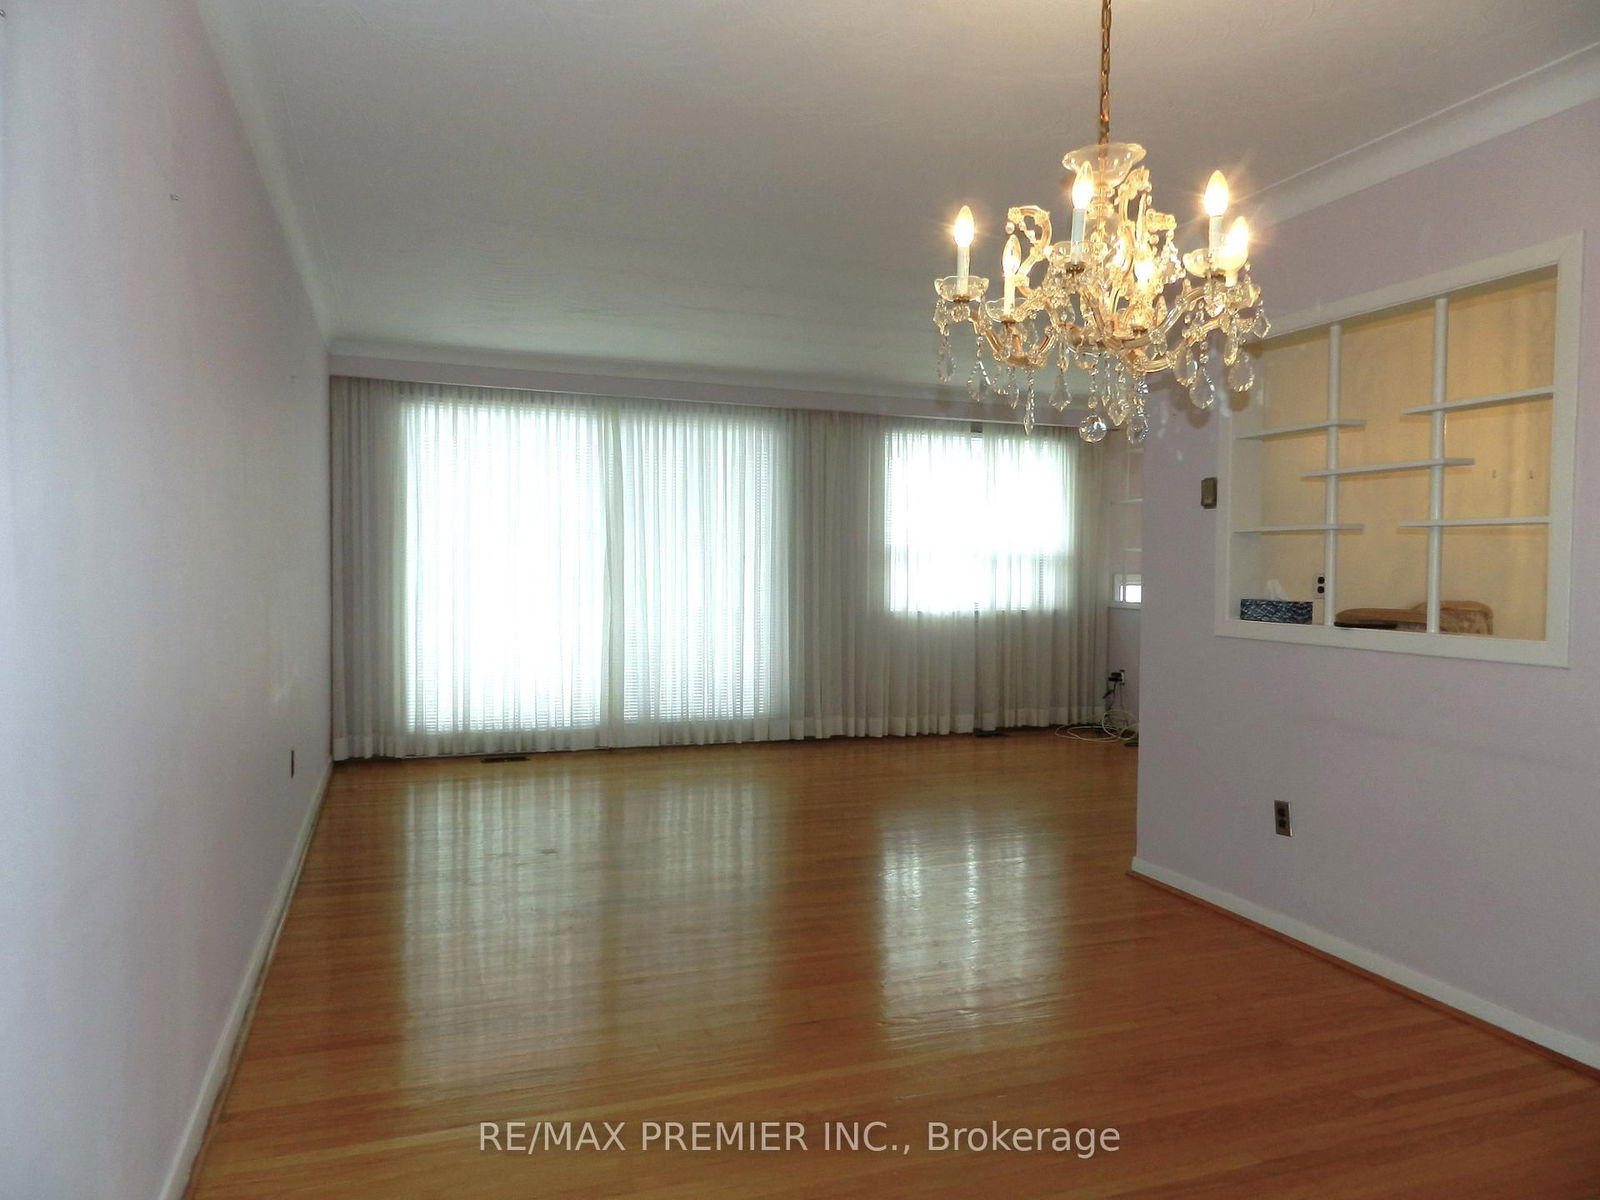
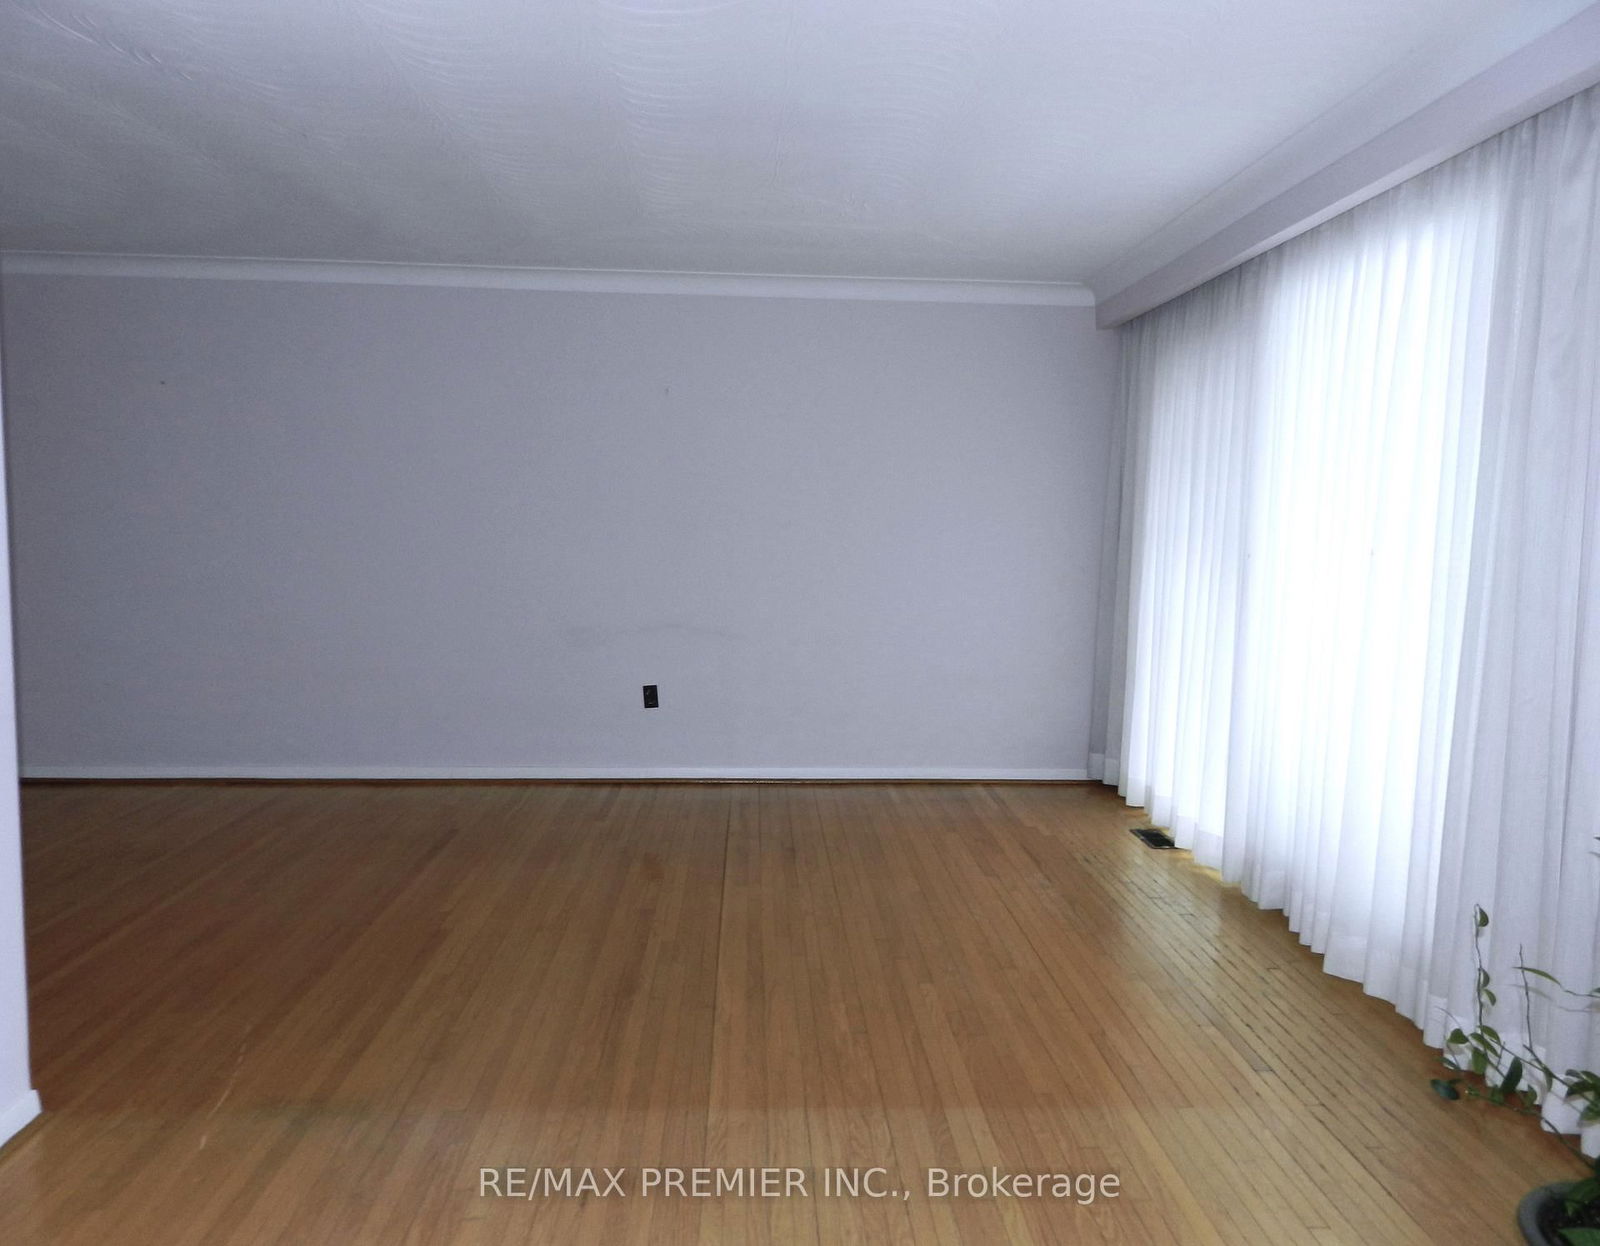
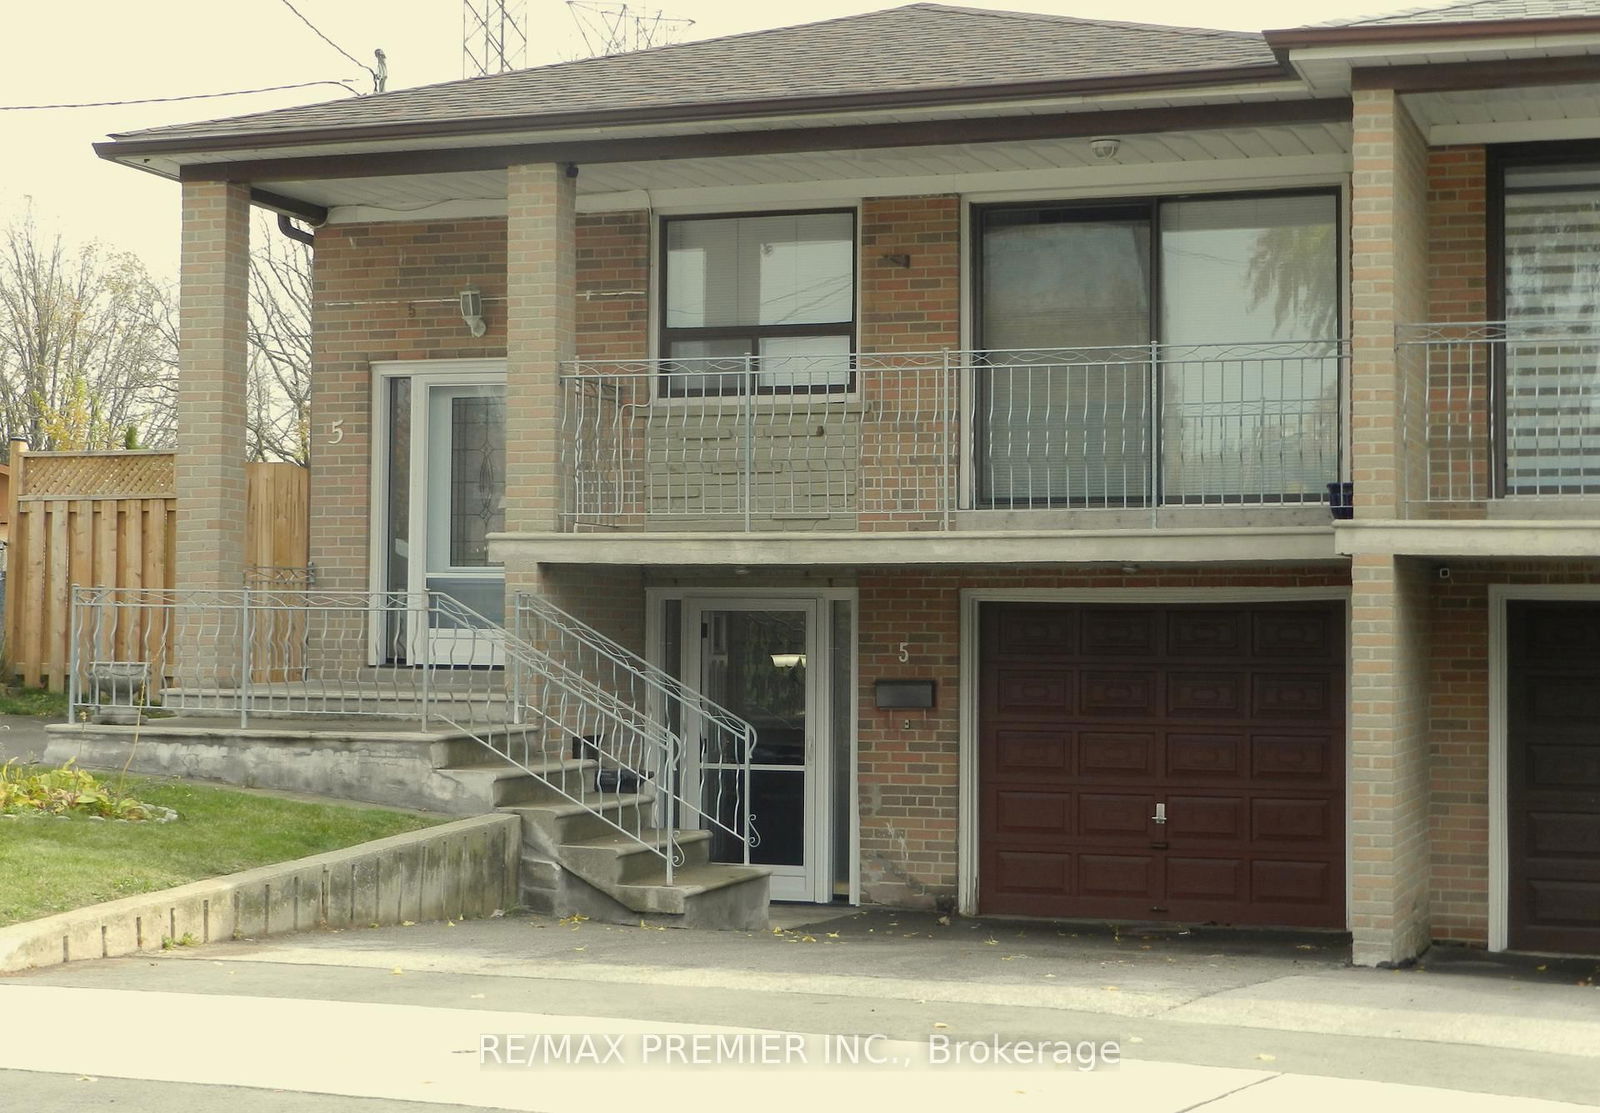
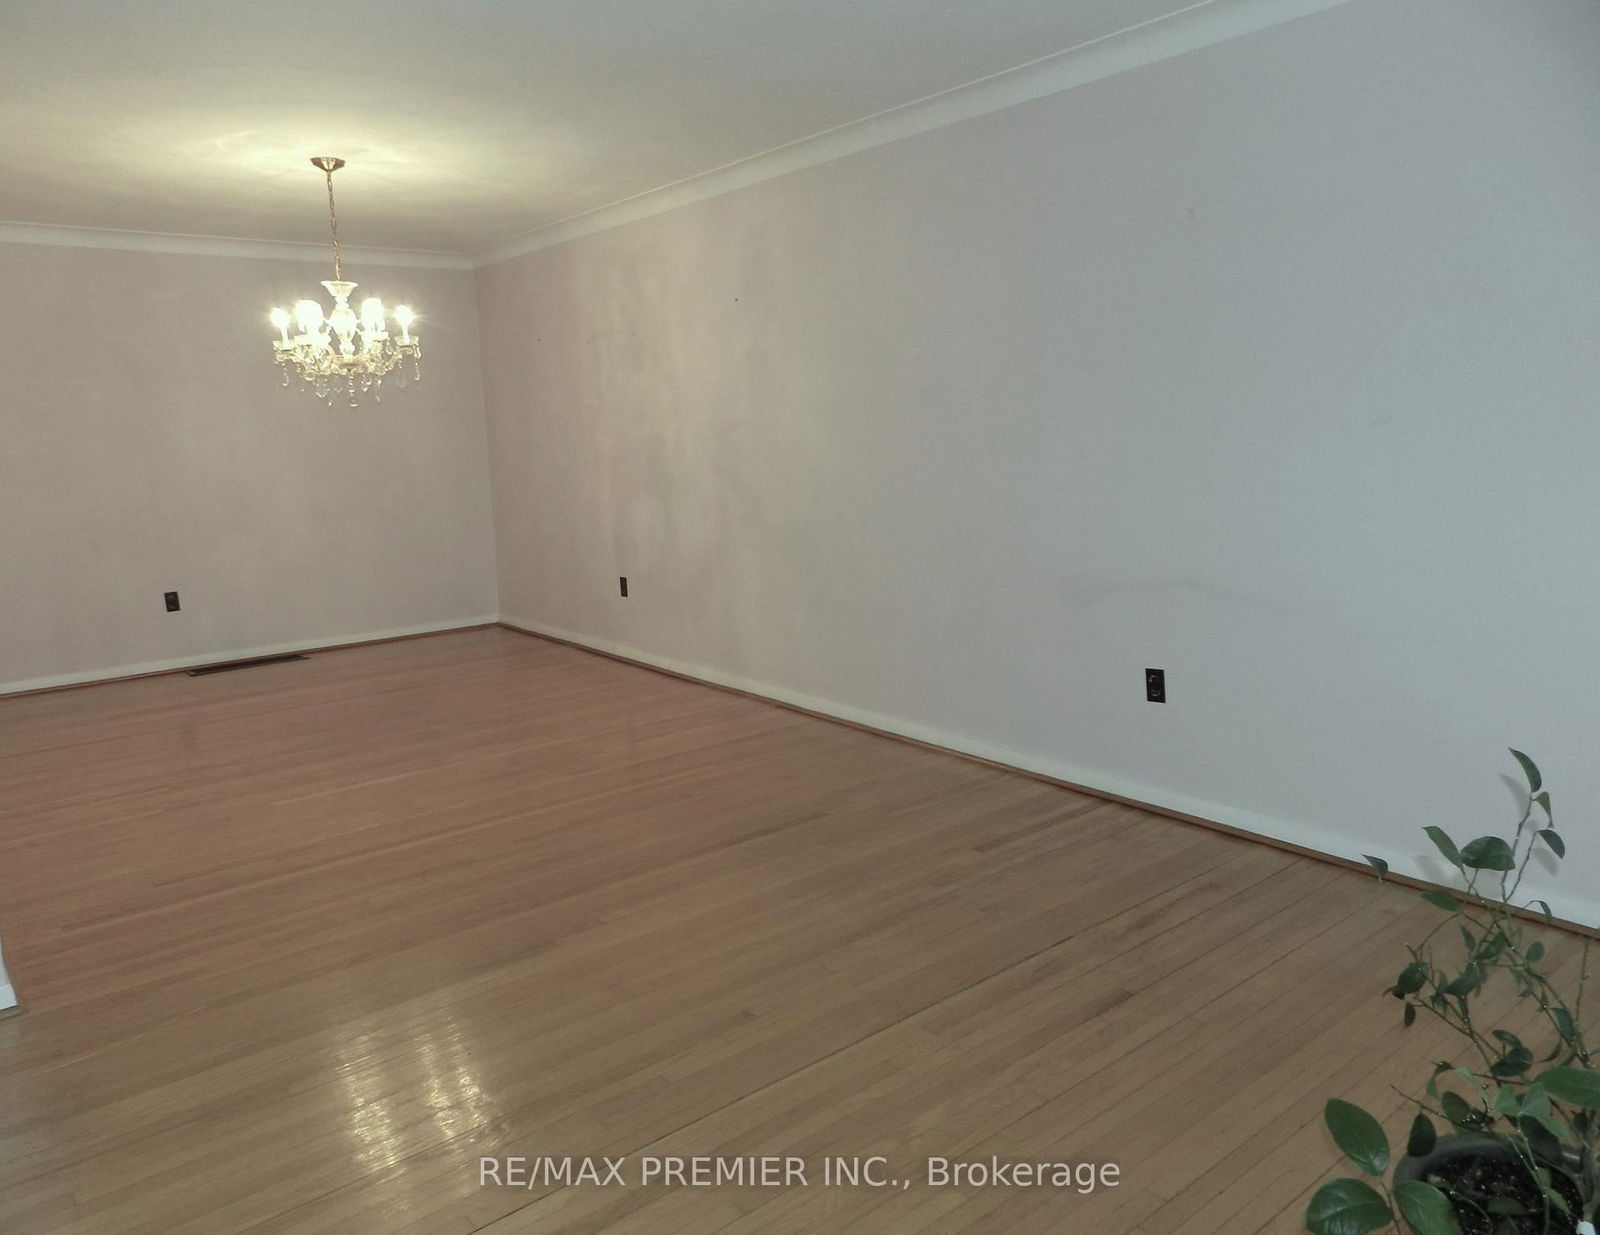
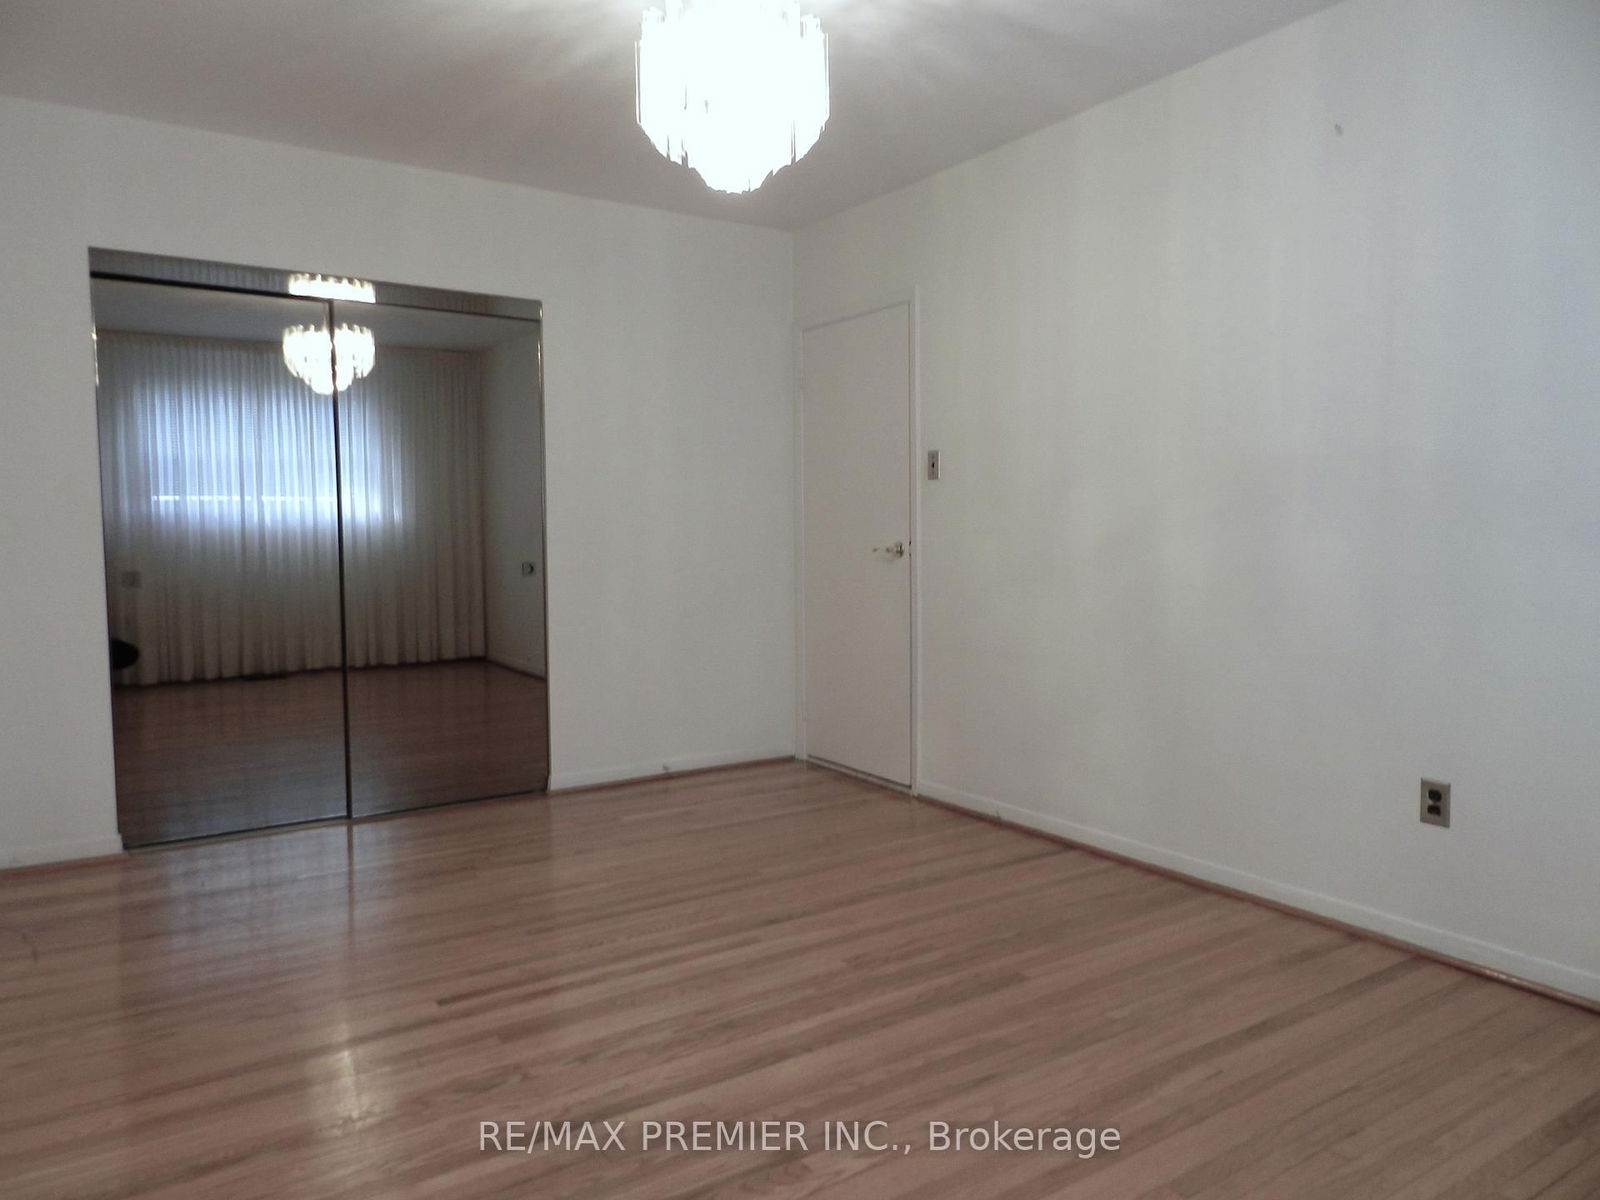
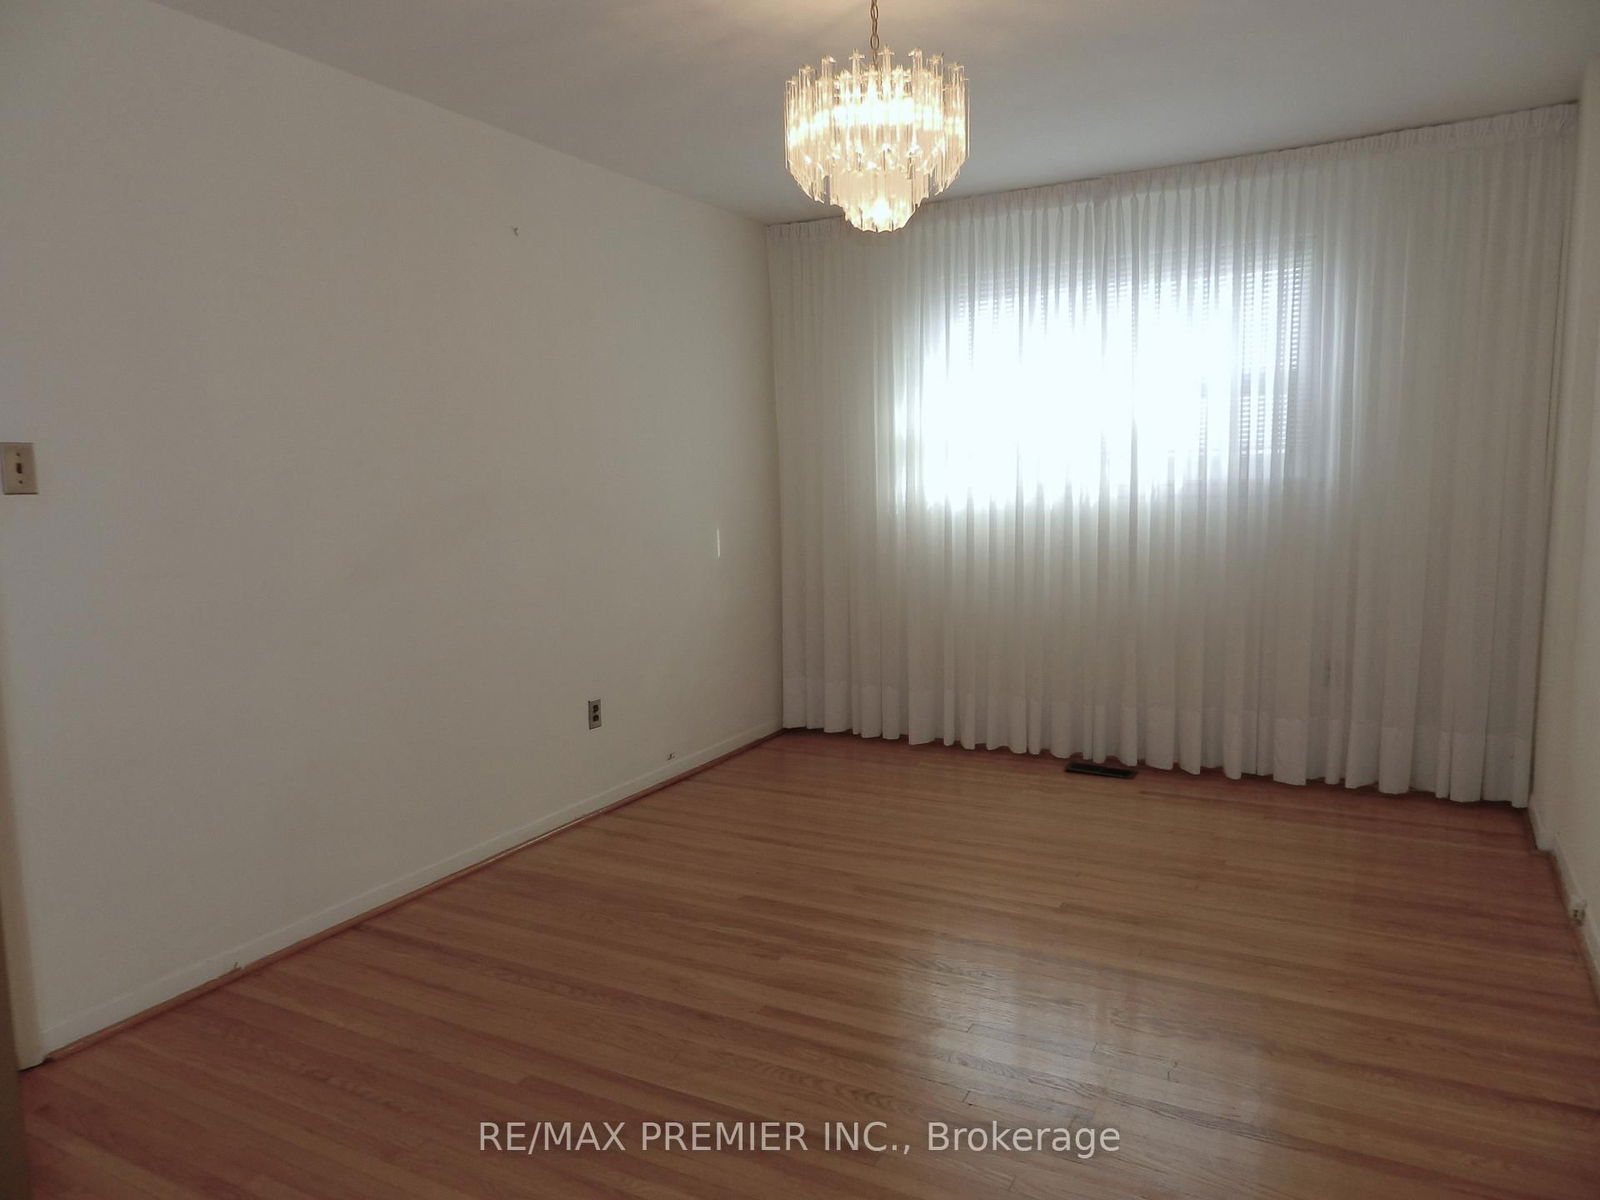
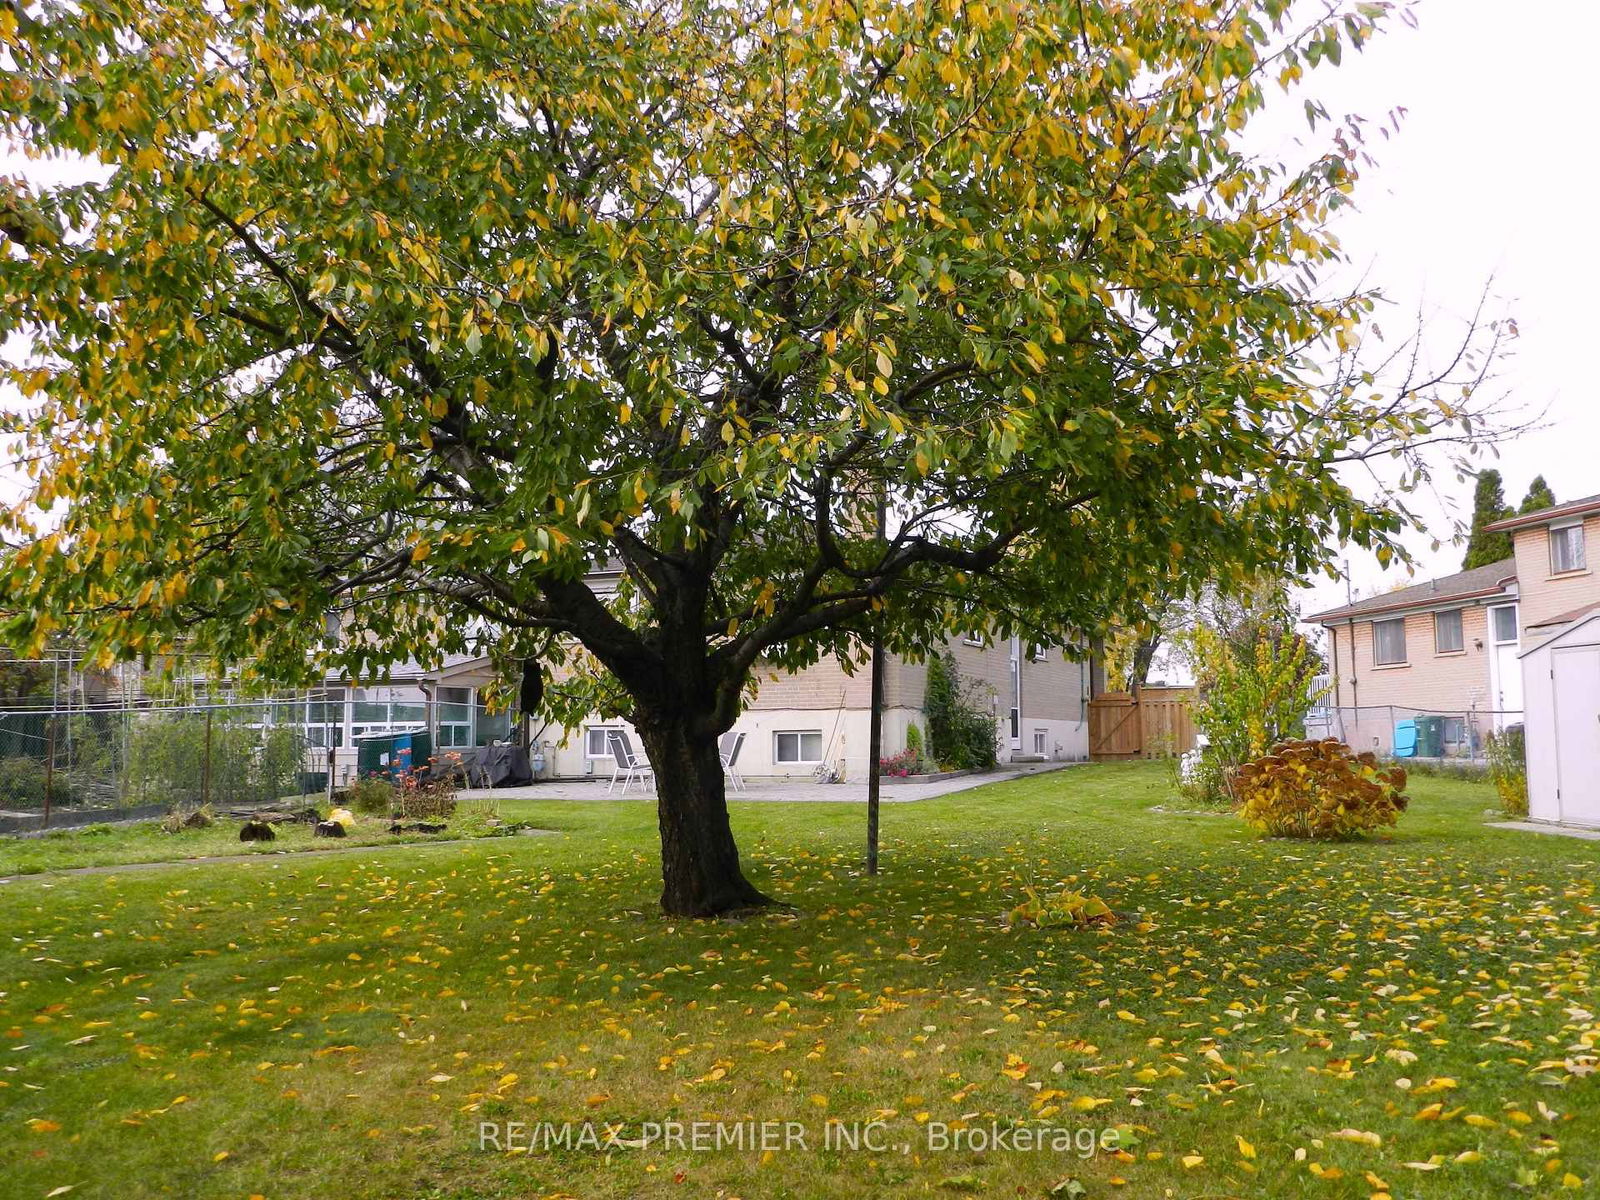
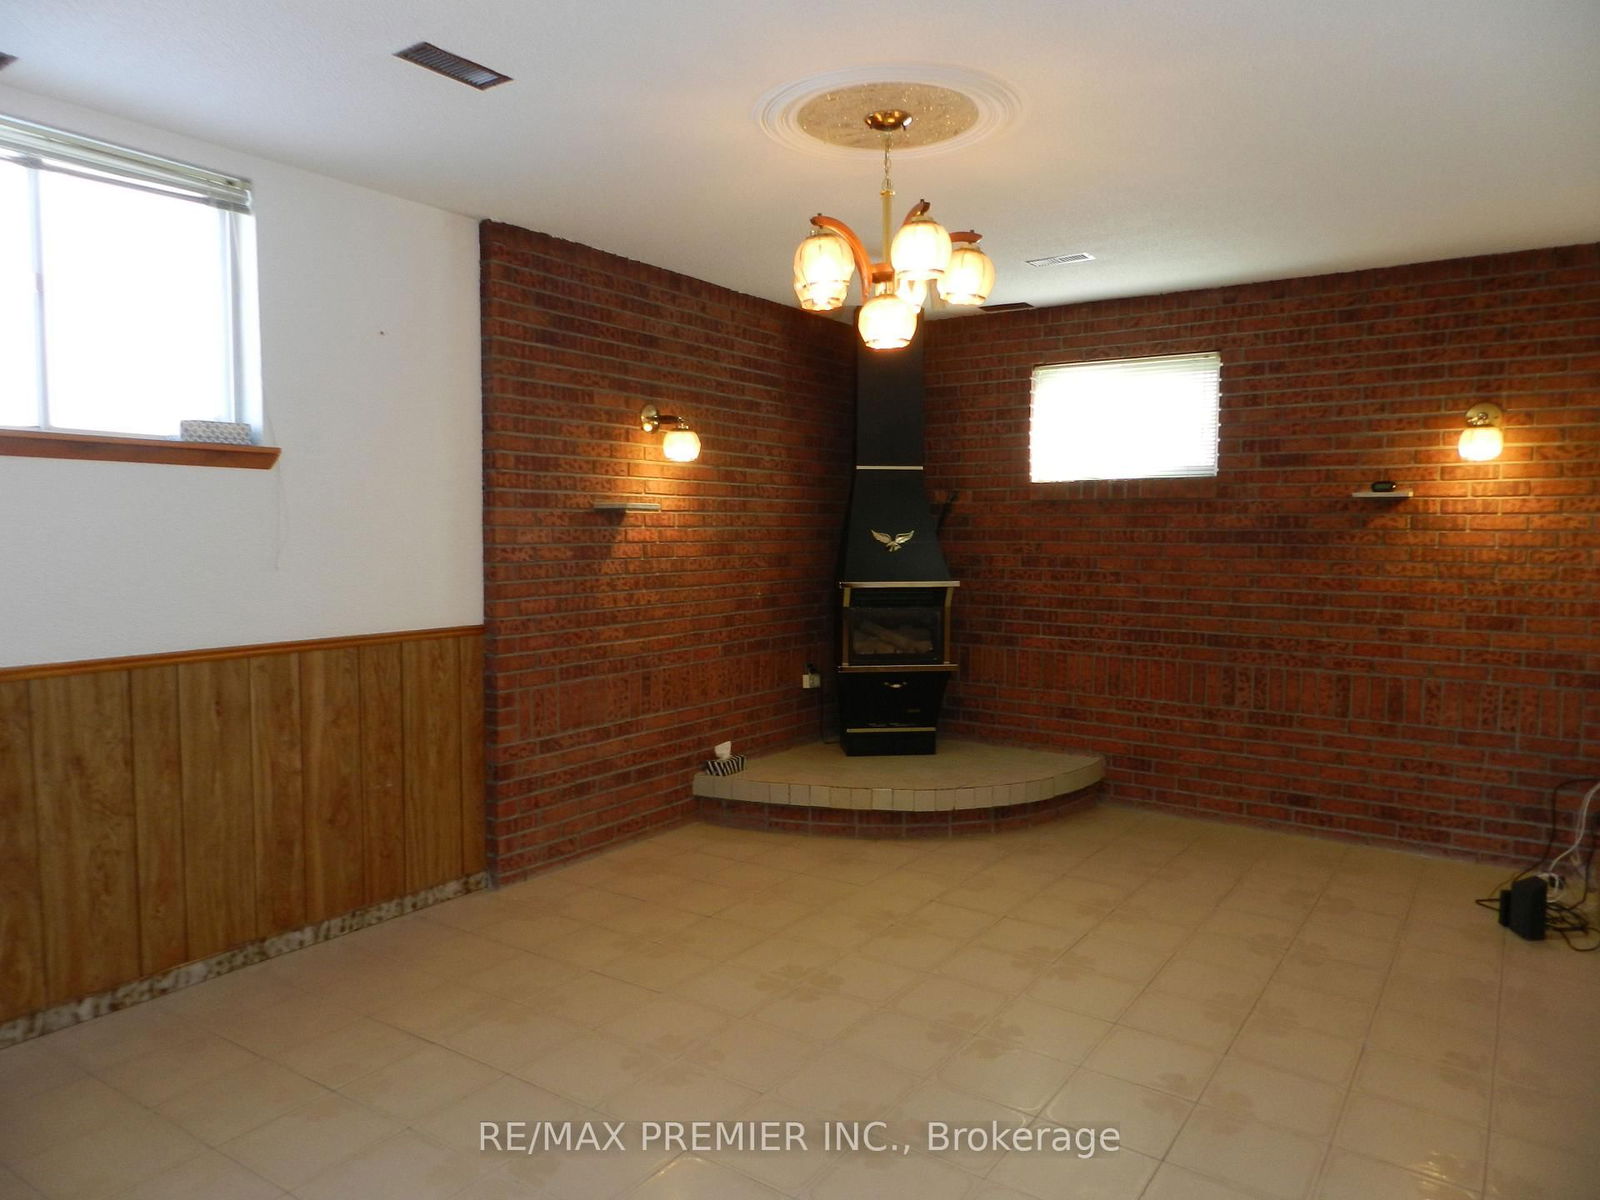
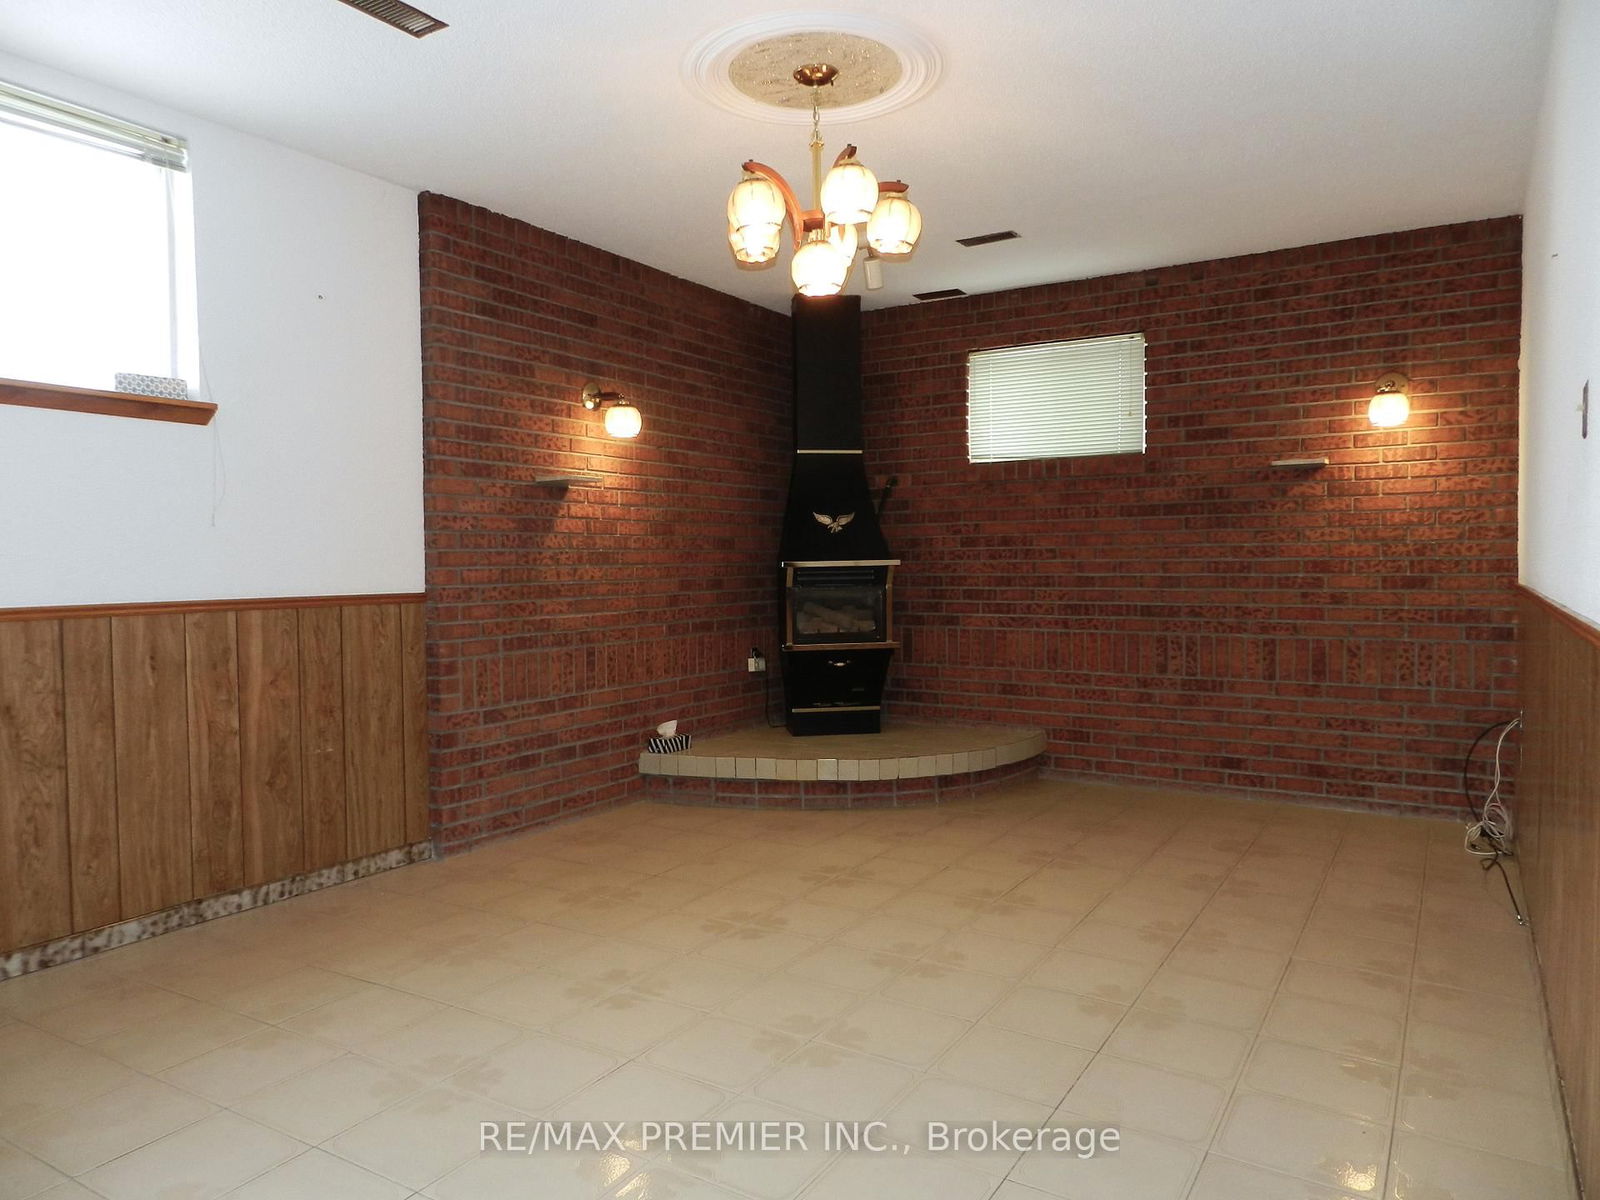
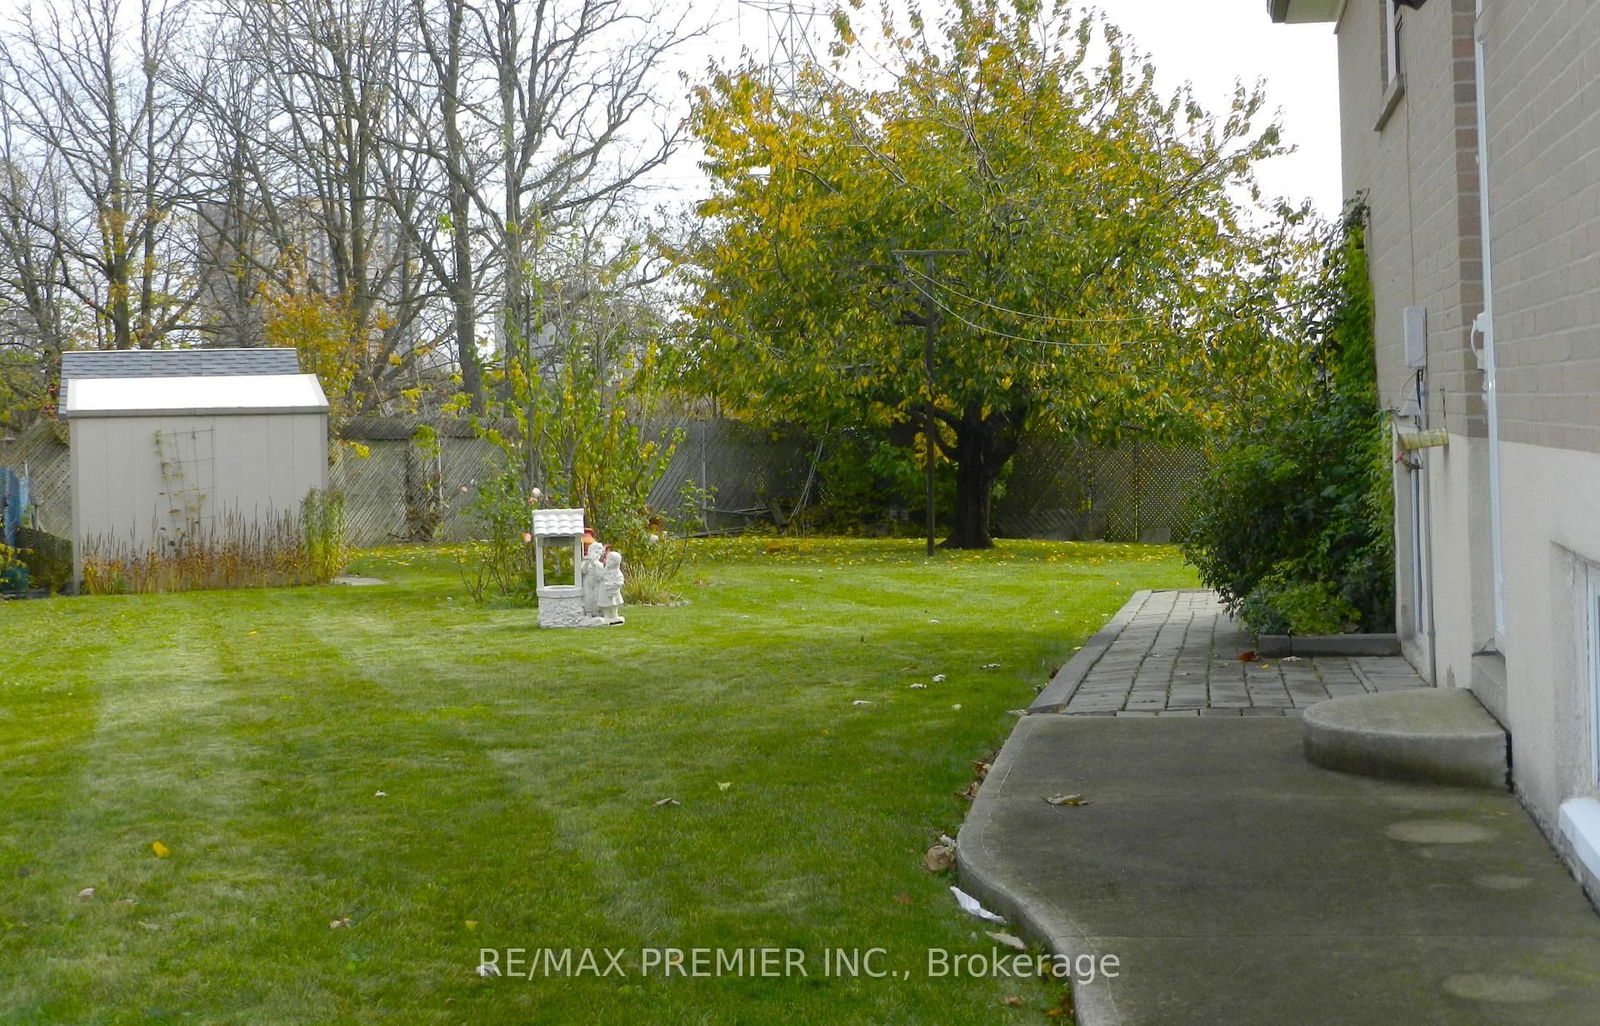
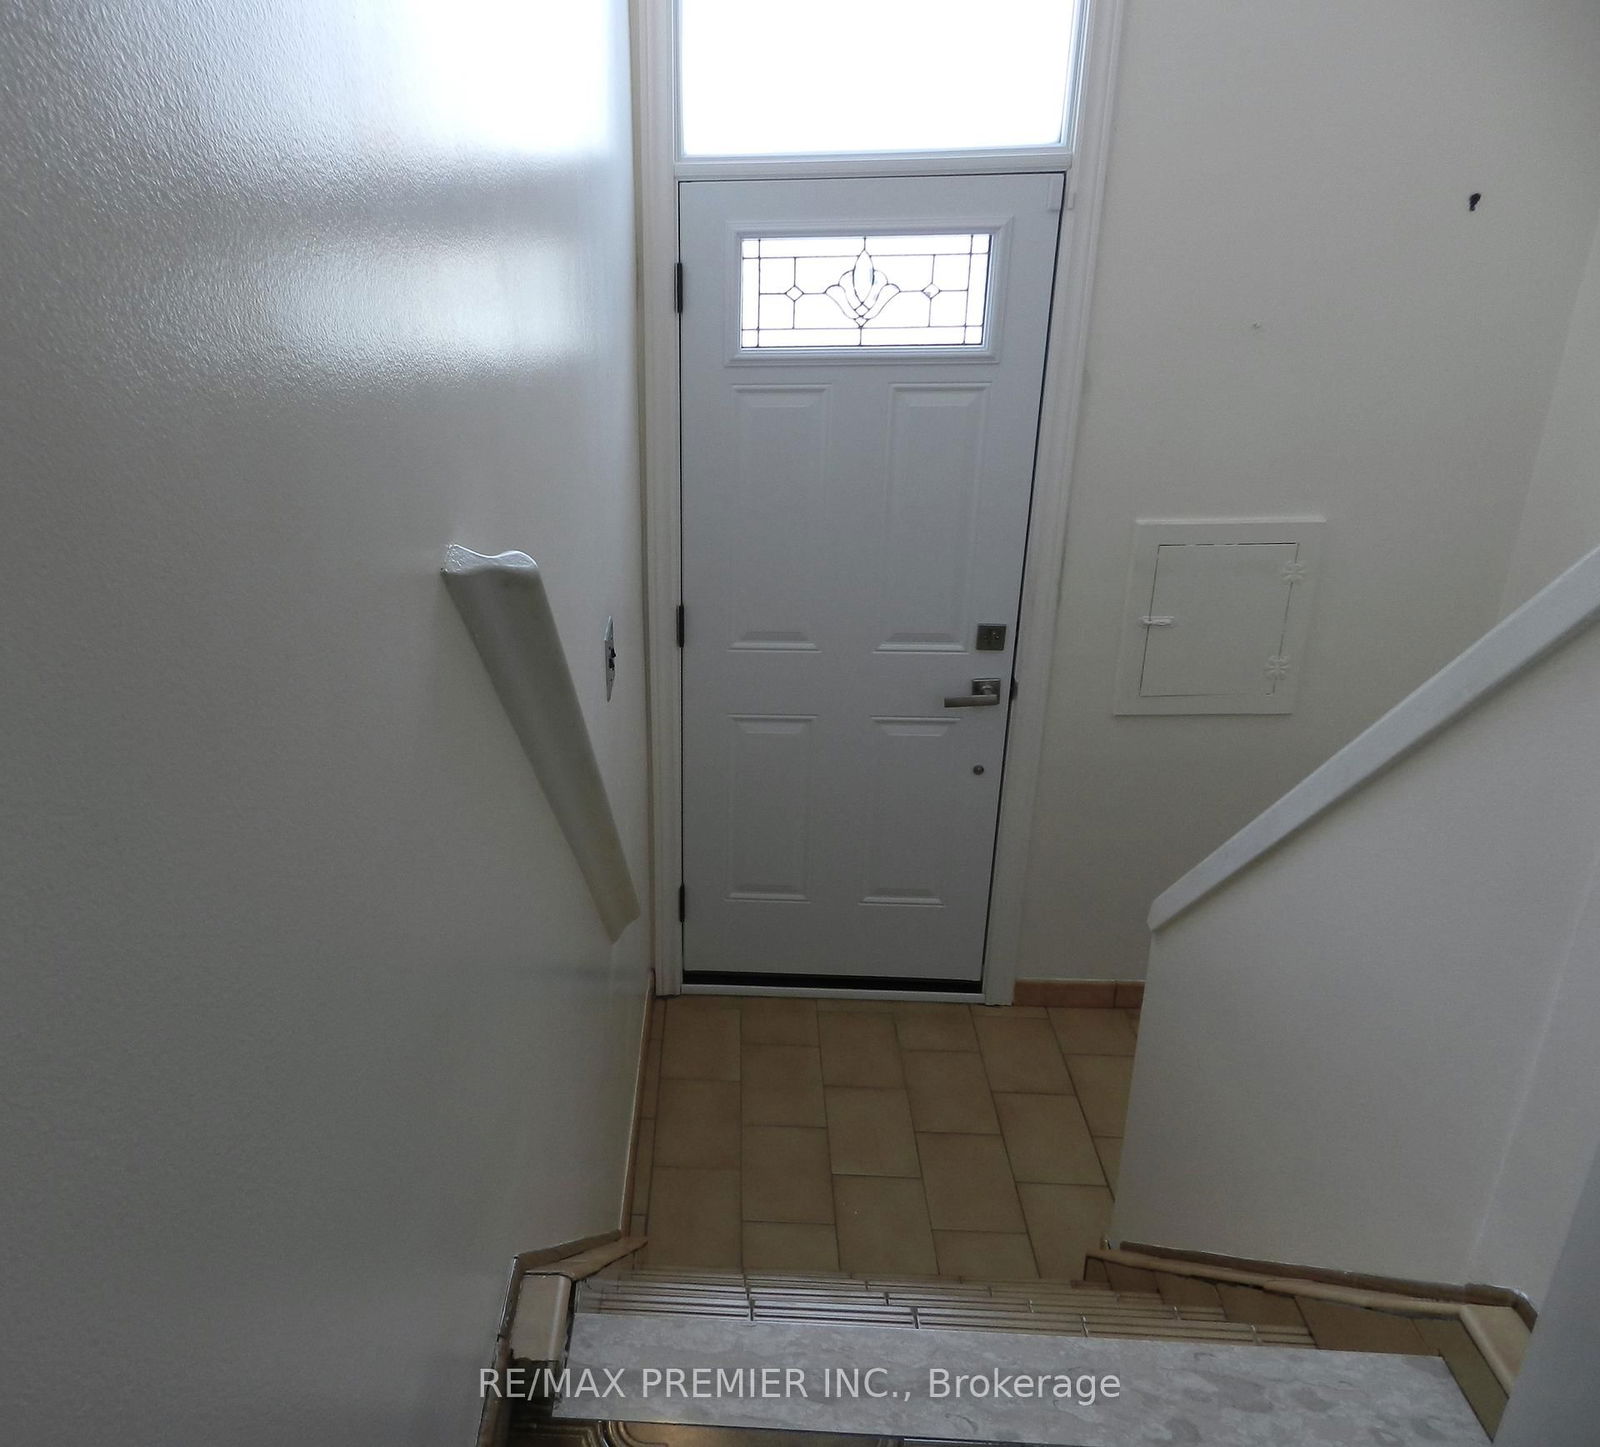
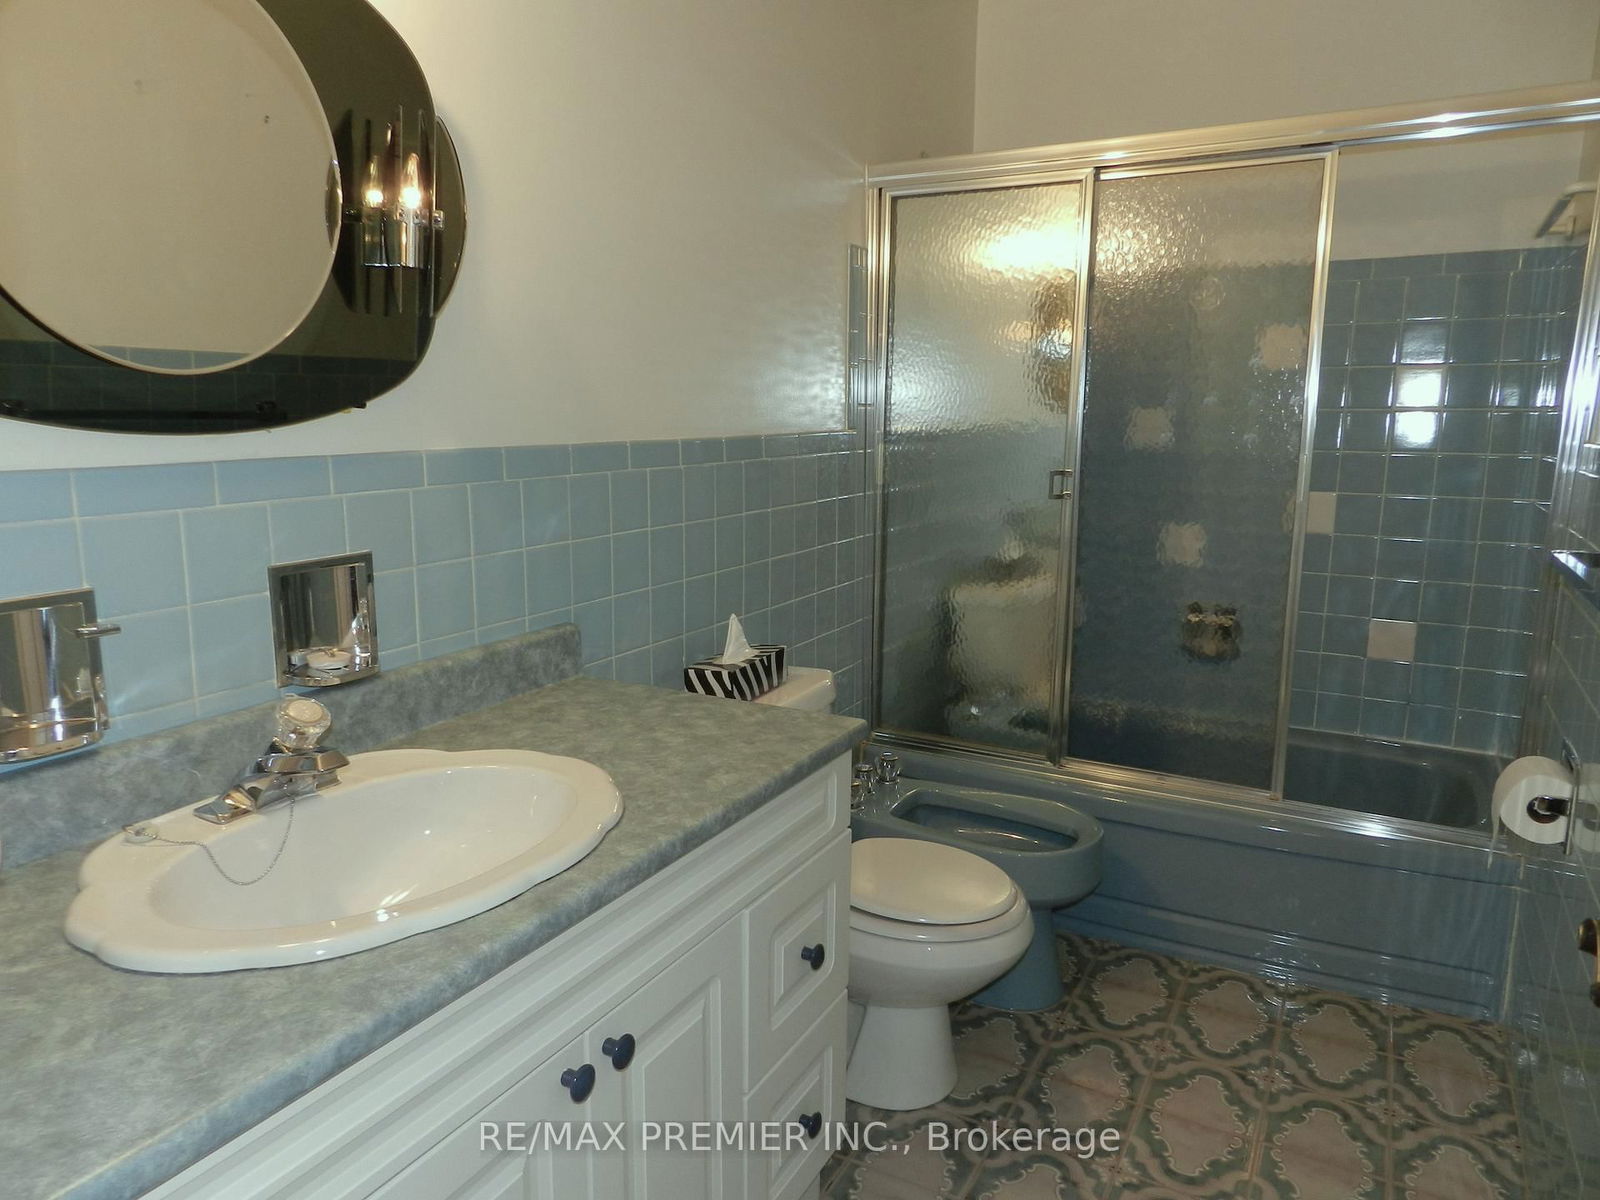
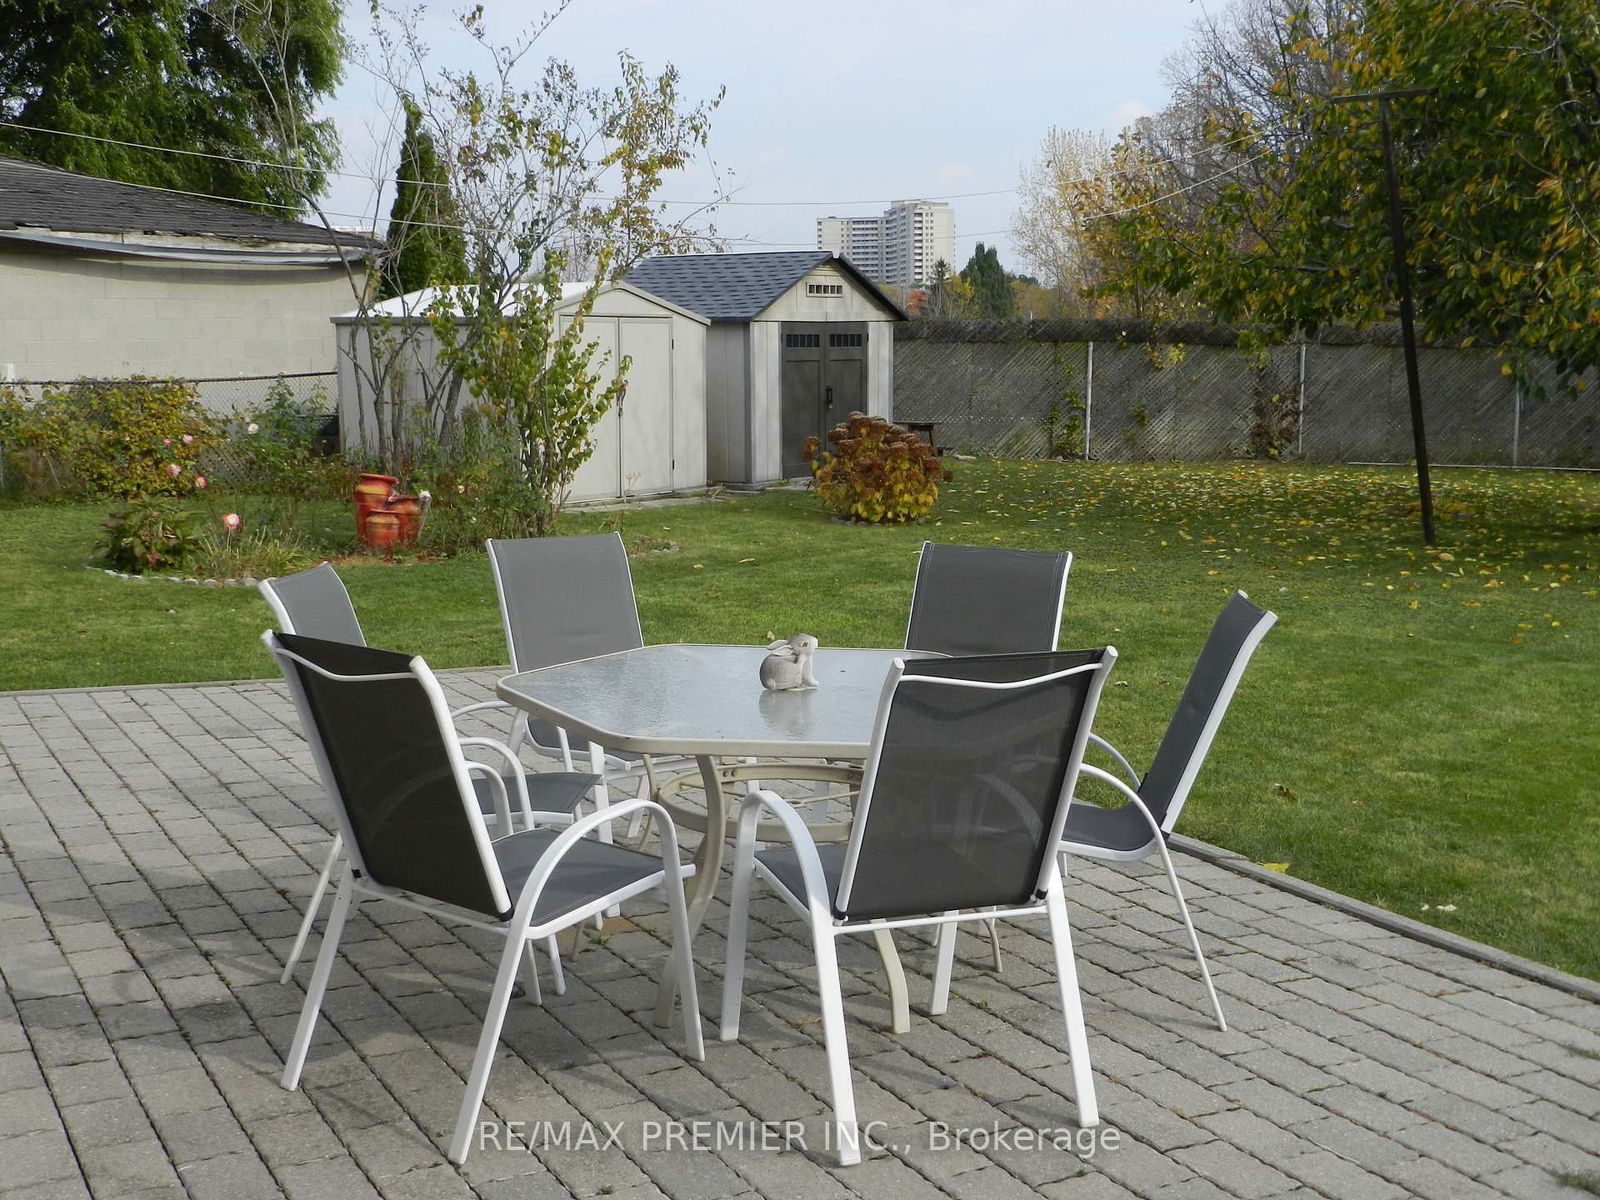
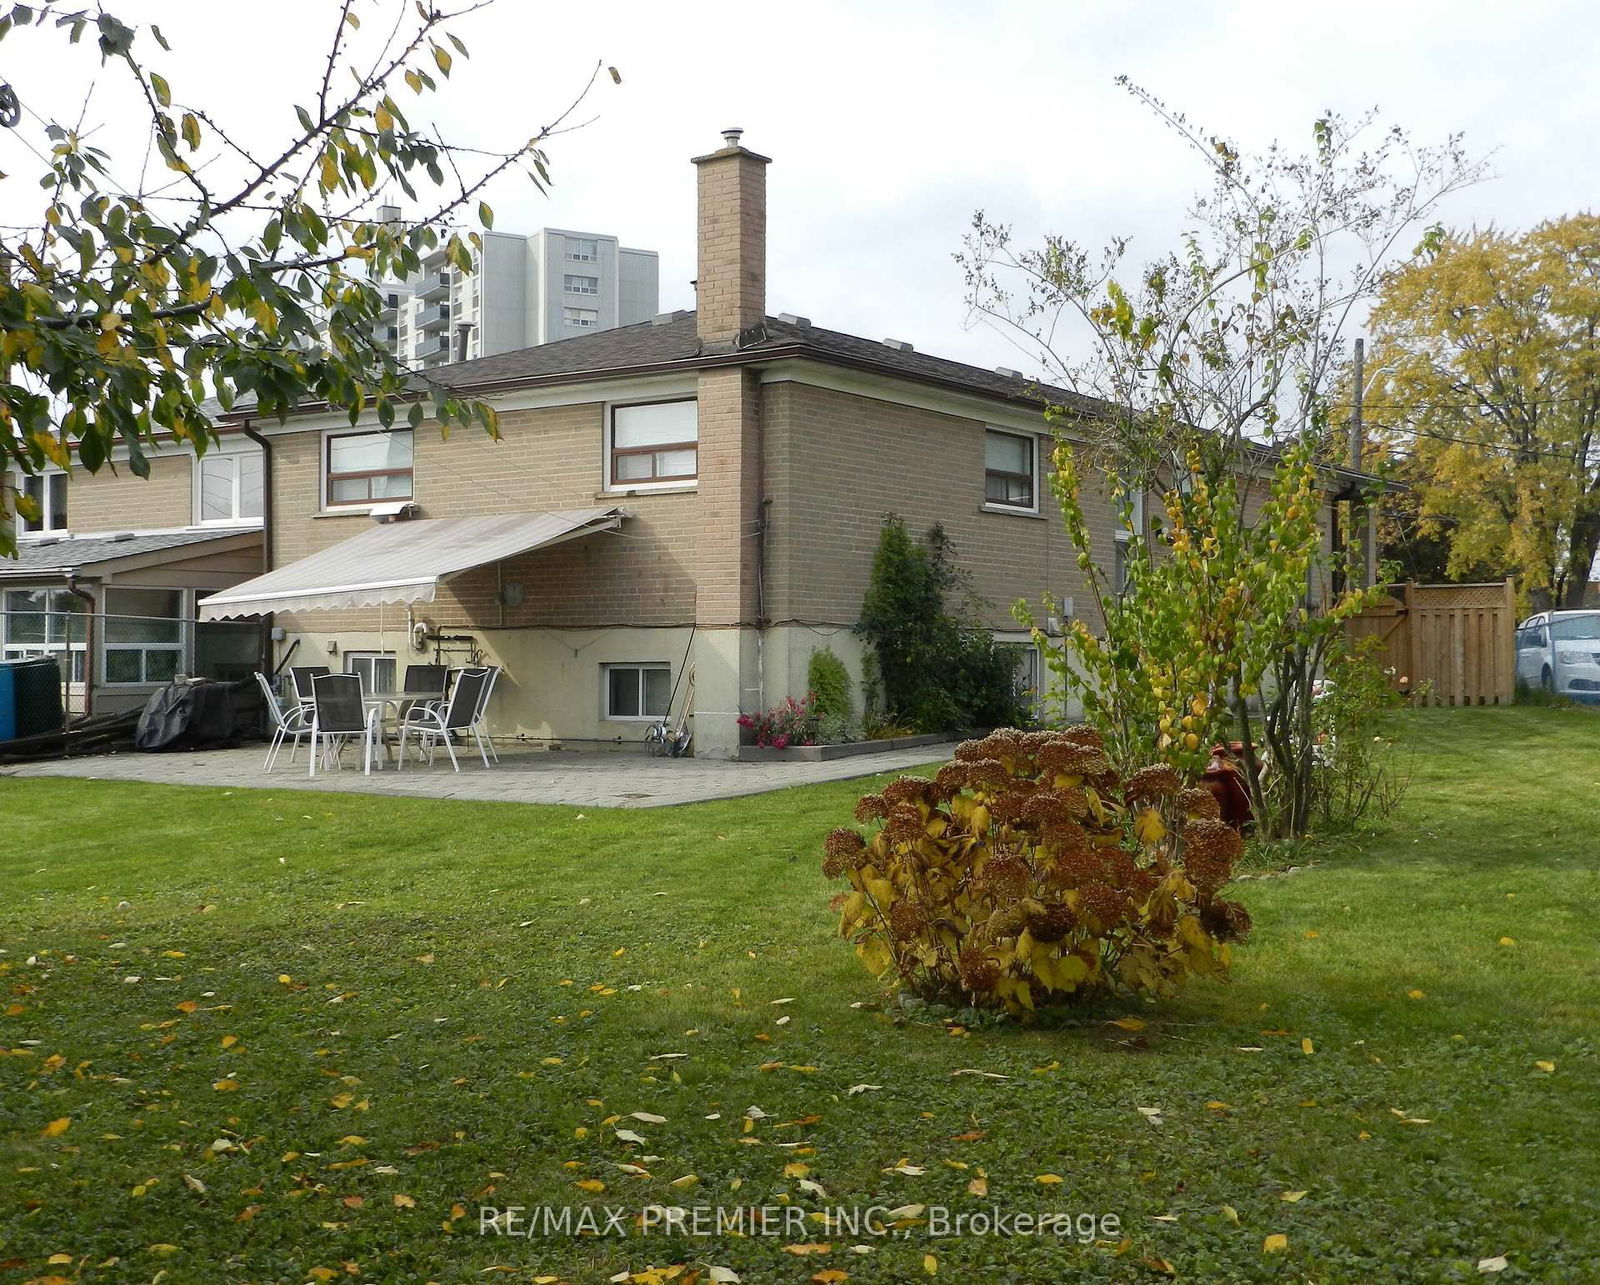
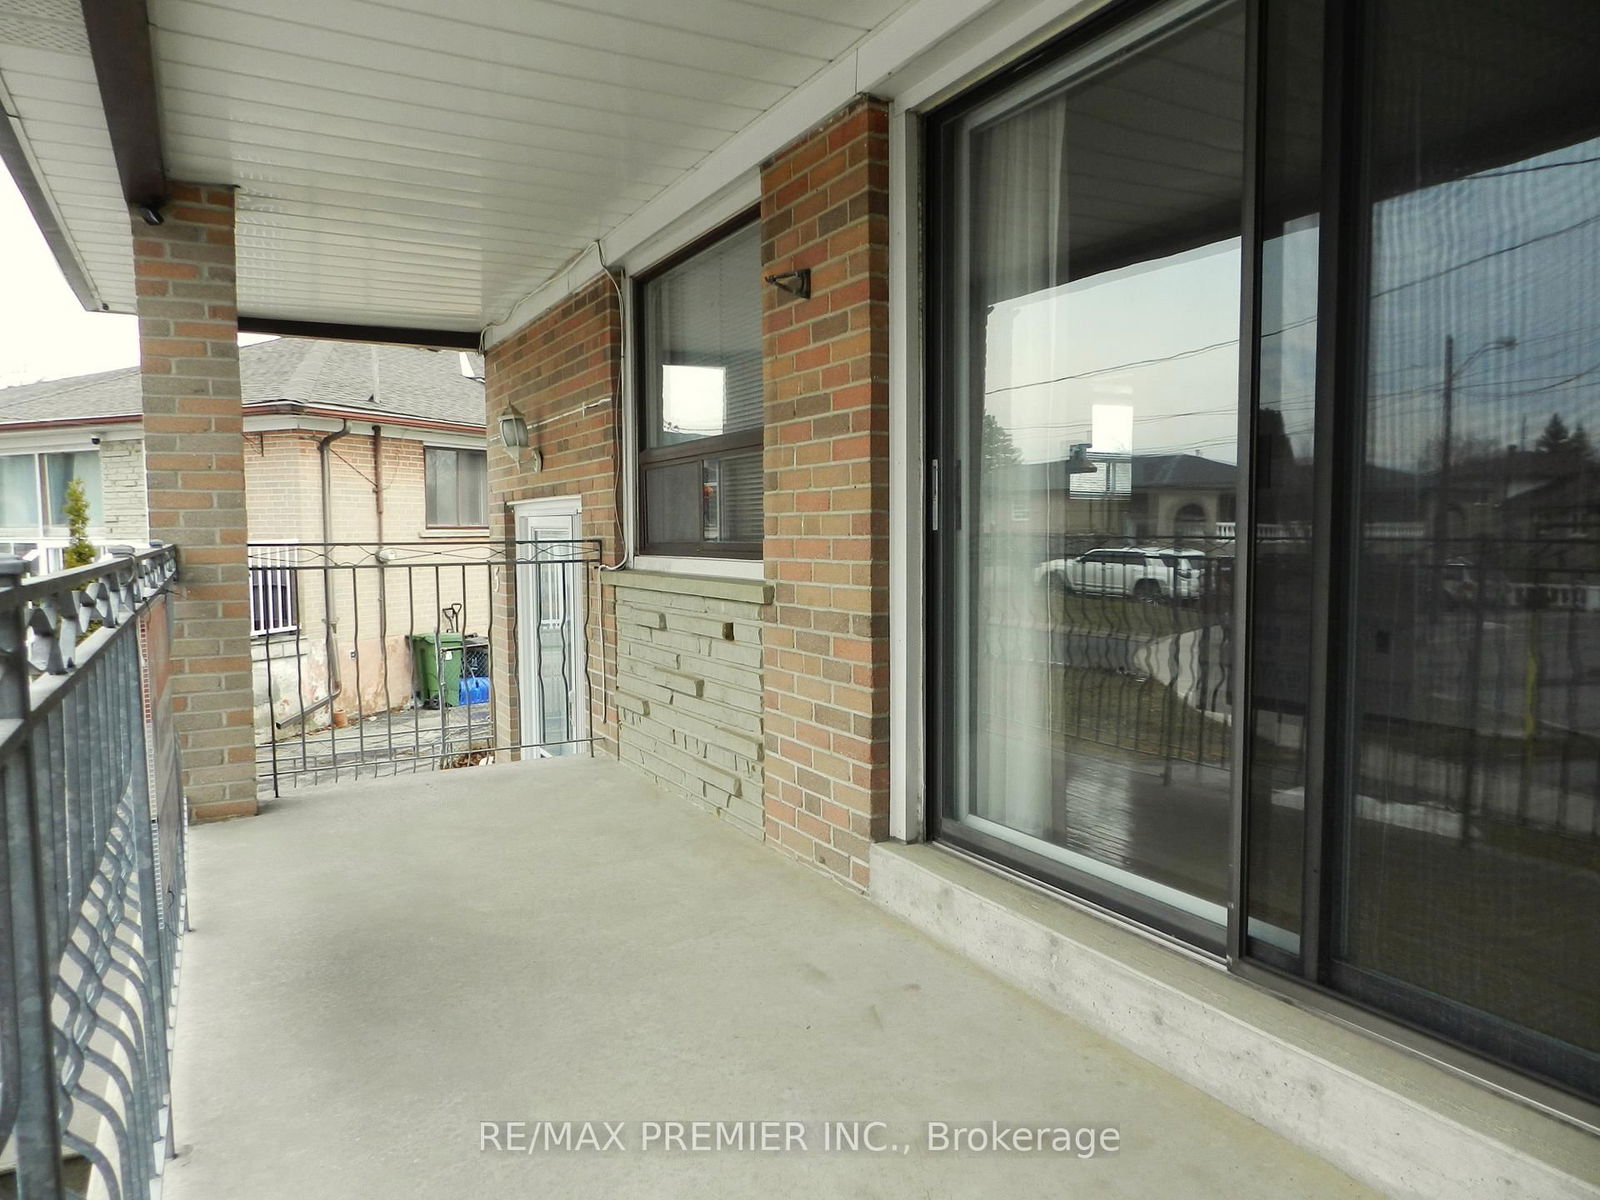
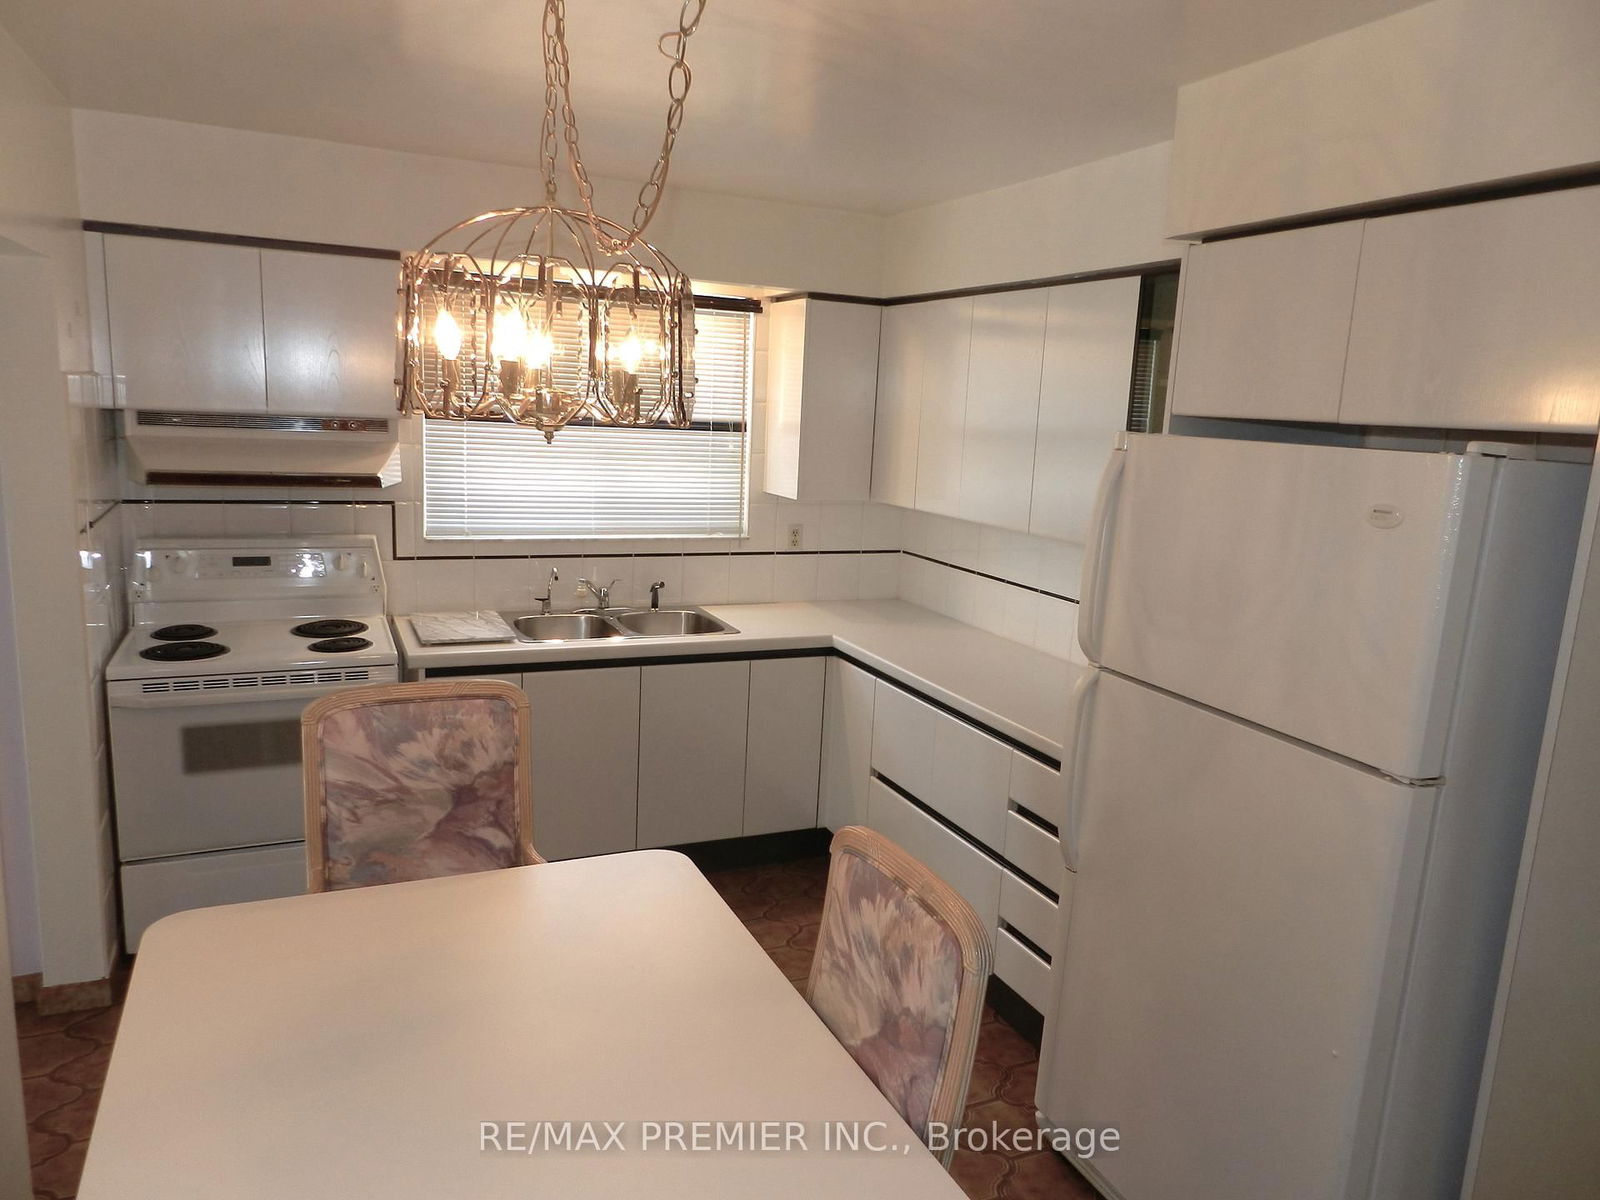
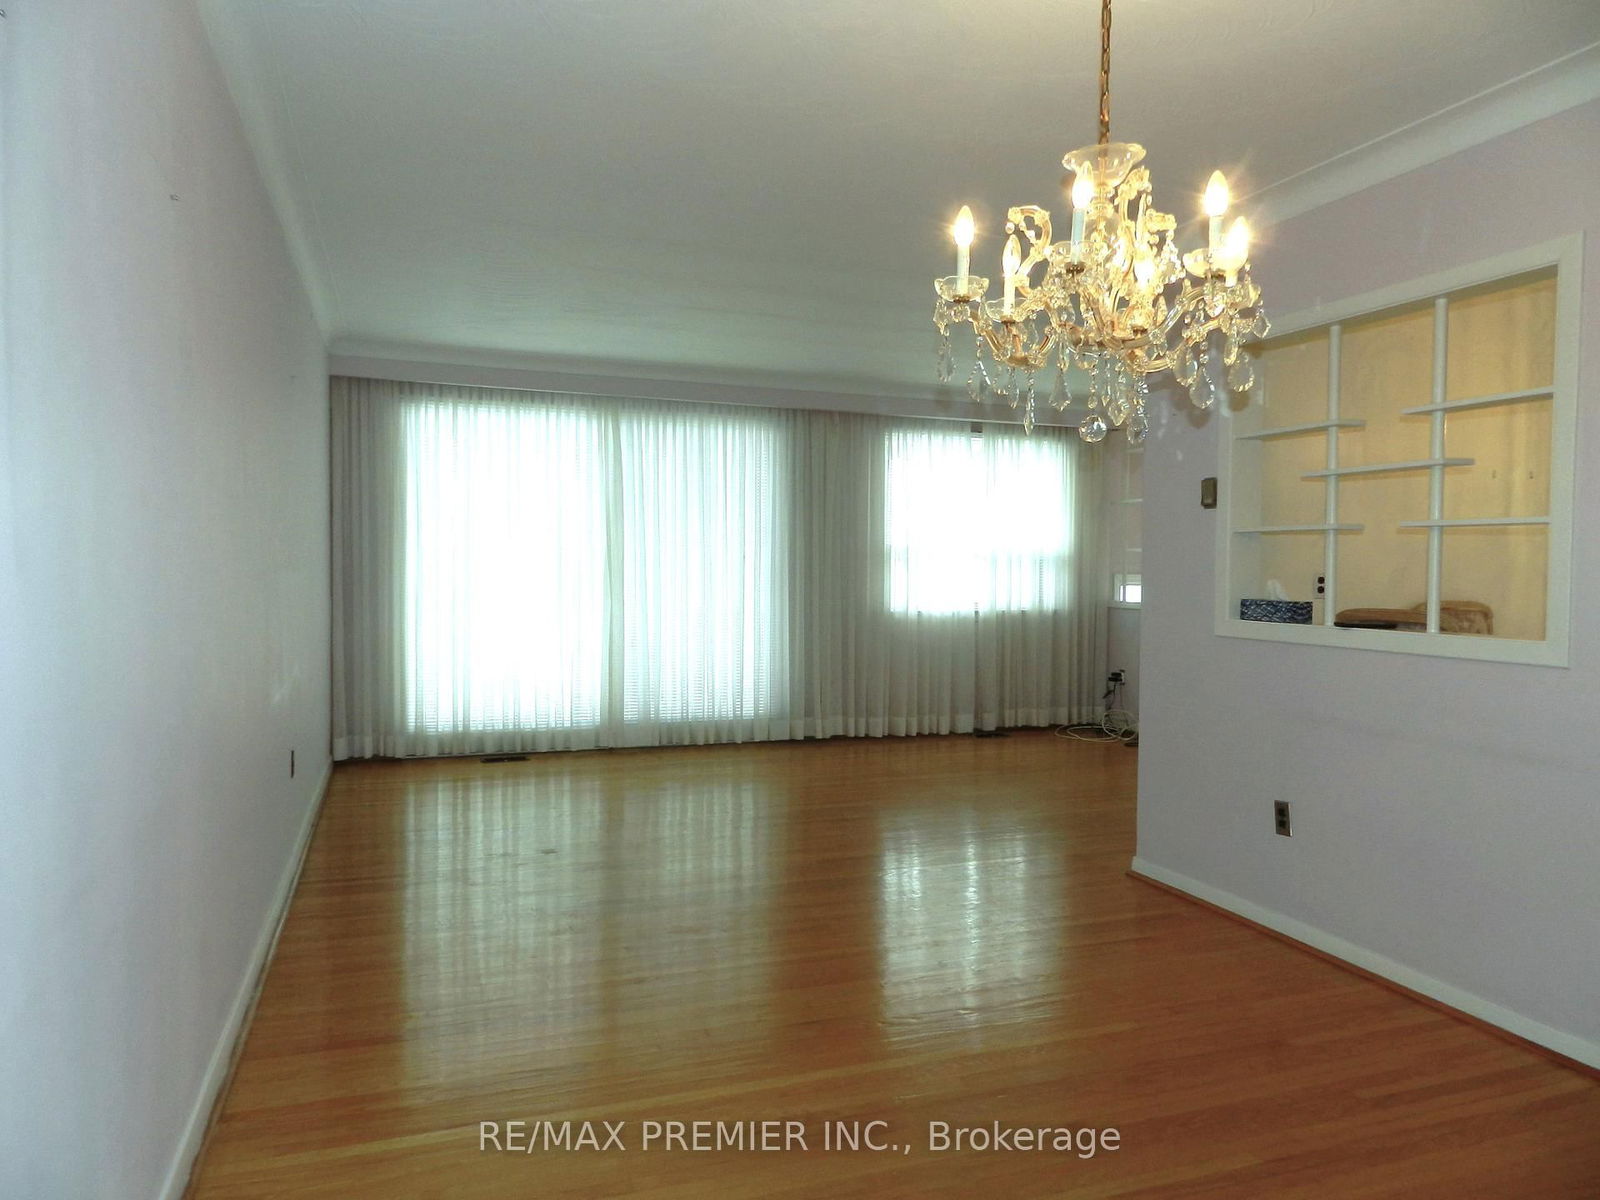
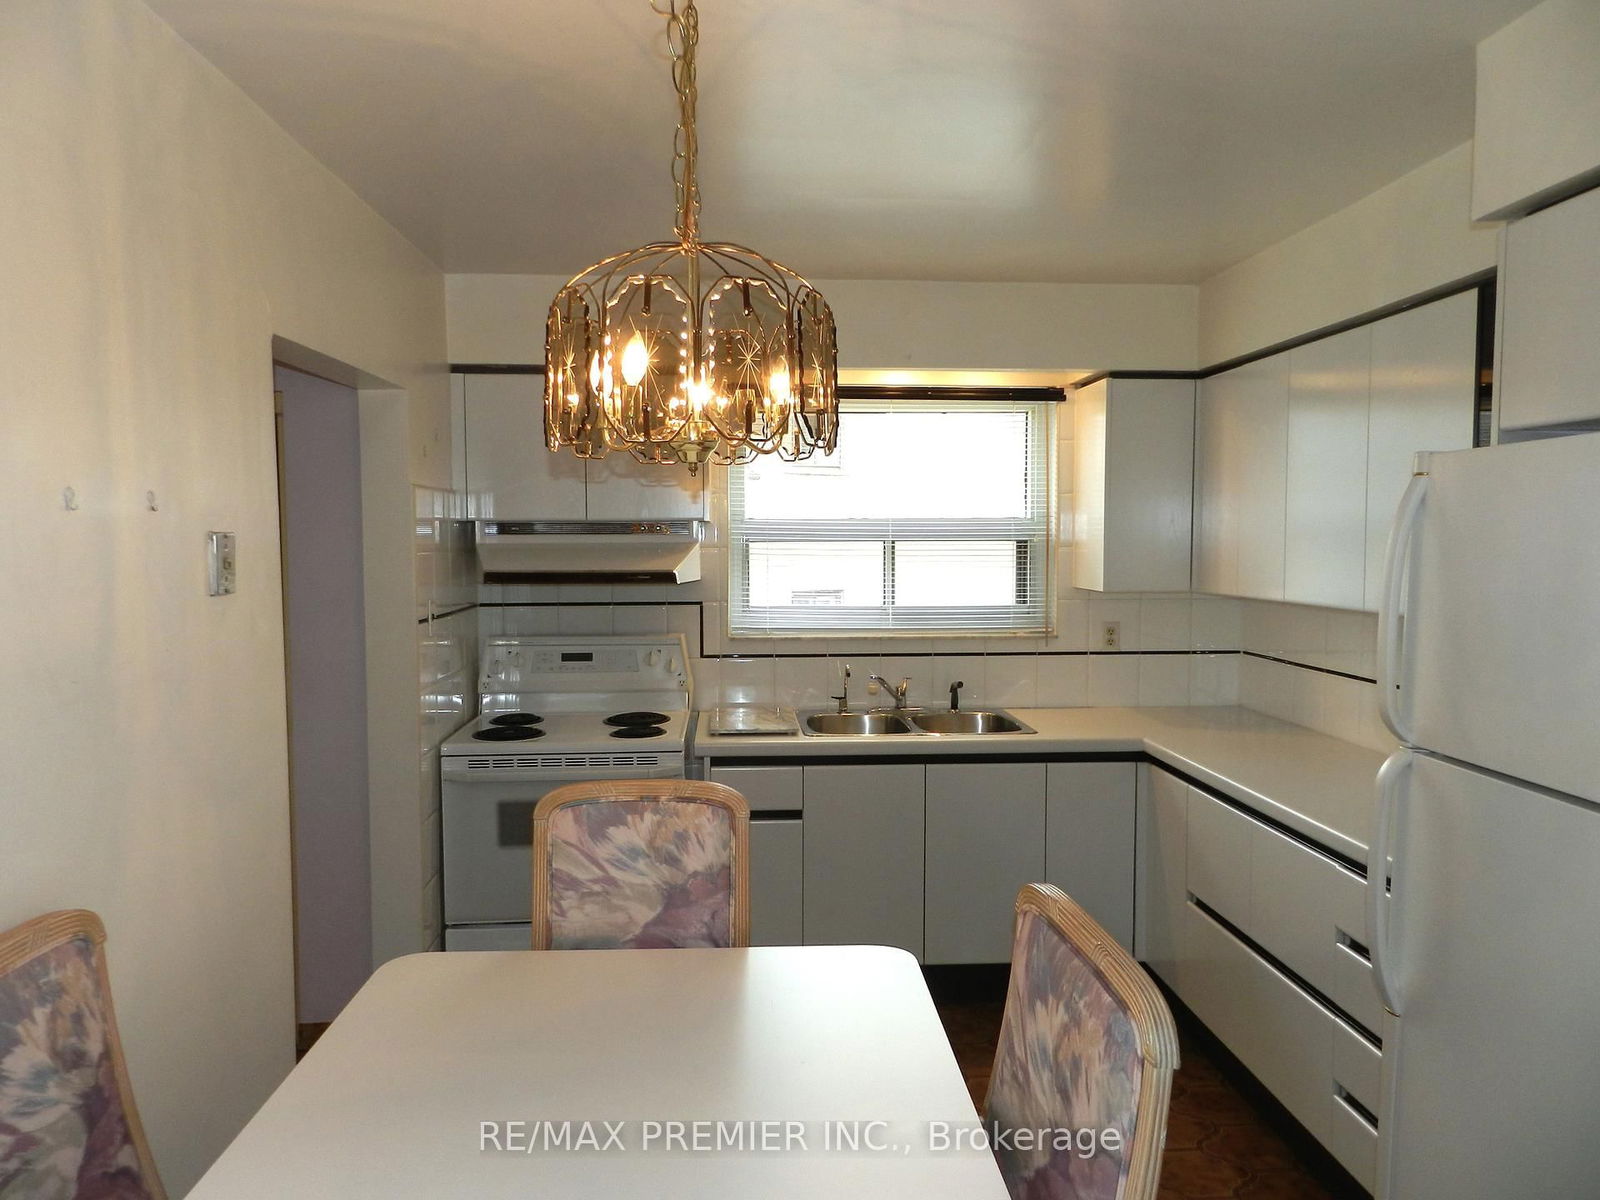
Private, Extra Deep Fenced Oversized Pie Shaped Lot. Loved, Meticulously Cared For Pride of Ownership. Original Owner. This Is An OpportunityTo Create Your Dream Home In The Heart Of The City. Situated In An Ideal, Quiet Family Friendly Court. Conveniently Located, This Home IsAwaiting Personal Touches Or Enjoy As Is. Having Approximately 1860 Sqft Of Finished Sun Bright Total Living Space. The Open Concept UpperLevel Features Include: Family Sized Kitchen, Open Concept Formal Dining Room and Oversized Living Room, Hardwood Floors ThroughoutUpper Level, Primary Bedroom with Double Closet, Bedrooms 2 + 3 Each Provide Functional Space With Closet And Windows; Linen + UtilityClosets For Ample Storage And Rare Laundry Chute Feature is a Bonus. The Side Separate Entrance Welcomes You To A Sun Bright FinishedBasement Perfect For Entertaining With Large Windows, High Ceilings and Boasts an Oversized Family Kitchen Complete With Fridge, Stove andDishwasher, A Spacious Rec Room With Gas Fireplace, A 3pc Bathroom. The Oversized Laundry Includes A Convenient Laundry Chute.Basement Includes Cold Room Storage. Backyard Provides A Great Space For Privacy and Lots of Room For Kids & Pets To Play + Run. RearYard Features A Covered Patio Area With Electric Remote Awning Ideal For Eating & Relaxing In The Shade. Back Yard With Irrigation and ShedWith Electrical Power. Perfect Family Home Having Superb Location + Proximity To Parks, Schools, Shops, Restaurants Public Transit/LRT andHighway 400.
All Appliances. Upper level Kitchen Fridge and Stove Lower. Level Kitchen Fridge, Stove and Dishwasher. Central Vac. Patio Awning with Remote.Two Sheds Rear Yard Irrigation Central Air, All Light Fixtures and Window Coverings
Kitchen
Dining
Living
Primary
2nd Br
3rd Br
Kitchen
Rec
Laundry
The graph below compares the average list price and average sale price of homes in this neighborhood by month for the last 24 months. When average sale price is greater than average list price, this may suggest a buyer's market. When average sale price is lower than the average list price this may suggest a seller's market.
The graph below illustrates the average days on market for homes in this neighborhood. The yellow area may indicate a buyer's market, the green area may indicate a balanced market and the red area may indicate a seller's market.
Sales Representative, Century 21 People’s Choice Realty Inc., Brokerage
(647) 576 - 2100
Toronto, Glenfield-Jane Heights, M3L 1Z7
Toronto, Glenfield-Jane Heights, M3L 1T2